450 MHz to 6000 MHz
TruPwr Detector
ADL5505
FEATURES
FUNCTIONAL BLOCK DIAGRAM
VPOS
True rms response detector
Excellent temperature stability
±0.25 dB rms detection accuracy vs. temperature
Over 35 dB input power dynamic range, inclusive of crest factor
RF bandwidths from 450 MHz to 6000 MHz
500 Ω input impedance
Single-supply operation: 2.5 V to 3.3 V
Low power: 1.8 mA at 3.0 V supply
RoHS-compliant part
ADL5505
RFIN
INTERNAL
FILTERING
100Ω
RMS CORE
VRMS
05799-001
BUFFER
COMM
Figure 1.
APPLICATIONS
Power measurement of W-CDMA, CDMA2000, QPSK-/QAMbased OFDM (LTE and WiMAX), and other complex
modulation waveforms
RF transmitter or receiver power measurement
10
OUTPUT (V)
1
0.01
–25
–20
–15
–10
–5
INPUT (dBm)
0
5
10
15
05799-002
0.1
Figure 2. Output vs. Input Level, Supply = 3.0 V, Frequency = 1900 MHz
GENERAL DESCRIPTION
The ADL5505 is a TruPwr™ mean-responding (true rms) power
detector for use in high frequency receiver and transmitter signal
chains from 450 MHz to 6000 MHz. Requiring only a single
supply between 2.5 V and 3.3 V, the detector draws less than
1.8 mA. The input is internally ac-coupled and has a nominal
input impedance of 500 Ω. The rms output is a linear-responding
dc voltage with a conversion gain of 1.86 V/V rms at 900 MHz.
The ADL5505 is a highly accurate, easy to use means of
determining the rms of complex waveforms. It can be used for
power measurements of both simple and complex waveforms
but is particularly useful for measuring high crest factor (high
peak-to-rms ratio) signals, such as W-CDMA, CDMA2000,
WiMAX, WLAN, and LTE waveforms.
The on-chip modulation filter provides adequate averaging for
most waveforms. An on-chip, 100 Ω series resistance at the
output, combined with an external shunt capacitor, creates a lowpass filter response that reduces the residual ripple in the dc output
voltage.
The ADL5505 offers excellent temperature stability across a
30 dB range and near 0 dB measurement error across temperature
over the top portion of the dynamic range. In addition to its
temperature stability, the ADL5505 offers low process variations
that further reduce calibration complexity.
The power detector operates from −40°C to +85°C and is
available in an 4-ball, 0.8 mm × 0.8 mm wafer-level chip scale
package. It is fabricated on a high fT silicon BiCMOS process.
Rev. A
Information furnished by Analog Devices is believed to be accurate and reliable. However, no
responsibility is assumed by Analog Devices for its use, nor for any infringements of patents or other
rights of third parties that may result from its use. Specifications subject to change without notice. No
license is granted by implication or otherwise under any patent or patent rights of Analog Devices.
Trademarks and registered trademarks are the property of their respective owners.
One Technology Way, P.O. Box 9106, Norwood, MA 02062-9106, U.S.A.
Tel: 781.329.4700
www.analog.com
Fax: 781.461.3113 ©2010-2011 Analog Devices, Inc. All rights reserved.
�ADL5505
TABLE OF CONTENTS
Features .............................................................................................. 1
Basic Connections ...................................................................... 14
Applications ....................................................................................... 1
RF Input Interfacing................................................................... 14
Functional Block Diagram .............................................................. 1
Linearity....................................................................................... 15
General Description ......................................................................... 1
Output Drive Capability and Buffering................................... 16
Revision History ............................................................................... 2
Selecting the Output Low-Pass Filter ...................................... 16
Specifications..................................................................................... 3
Power Consumption .................................................................. 17
Absolute Maximum Ratings............................................................ 6
Device Calibration and Error Calculation .............................. 17
ESD Caution .................................................................................. 6
Calibration for Improved Accuracy ......................................... 18
Pin Configuration and Function Descriptions ............................. 7
Drift Over a Reduced Temperature Range ............................. 18
Typical Performance Characteristics ............................................. 8
Device Handling ......................................................................... 18
Circuit Description ......................................................................... 13
Land Pattern and Soldering Information ................................ 18
RMS Circuit Description and Filtering ................................... 13
Evaluation Board ........................................................................ 18
Filtering ........................................................................................ 13
Outline Dimensions ....................................................................... 20
Output Buffer .............................................................................. 13
Ordering Guide .......................................................................... 20
Applications Information .............................................................. 14
REVISION HISTORY
1/11—Rev. 0 to Rev. A
Updated Outline Dimensions, Figure 46..................................... 20
Change to Ordering Guide, Package Option .............................. 20
4/10—Revision 0: Initial Version
Rev. A | Page 2 of 20
�ADL5505
SPECIFICATIONS
TA = 25°C, VS = 3.0 V, COUT = open, light condition ≤ 600 lux, 75 Ω input termination resistor, unless otherwise noted.
Table 1.
Parameter
FREQUENCY RANGE
RF INPUT (f = 450 MHz)
Input Impedance
RMS Conversion
Dynamic Range 1
±0.25 dB Error 2
±0.25 dB Error 3
±1 dB Error3
±2 dB Error3
Maximum Input Level
Minimum Input Level
Conversion Gain
Output Intercept 4
Output Voltage, High Input Power
Output Voltage, Low Input Power
Temperature Sensitivity
RF INPUT (f = 900 MHz)
Input Impedance
RMS Conversion
Dynamic Range1
±0.25 dB Error2
±0.25 dB Error3
±1 dB Error3
±2 dB Error3
Maximum Input Level
Minimum Input Level
Conversion Gain
Output Intercept4
Output Voltage, High Input Power
Output Voltage, Low Input Power
Temperature Sensitivity
Test Conditions
Input RFIN
Input RFIN to output VRMS
No termination
Min
450
Continuous wave (CW) input, −40°C < T A < +85°C
Delta from 25°C
±0.25 dB error3
±1 dB error3
VRMS = (gain × VIN) + intercept
PIN = 5 dBm, 400 mV rms
PIN = −15 dBm, 40 mV rms
PIN = 0 dBm
+25°C < TA < +85°C
−40°C < TA < +25°C
Input RFIN to output VRMS
No termination
Continuous wave (CW) input, −40°C < T A < +85°C
Delta from 25°C
±0.25 dB error3
±1 dB error3
VRMS = (gain × VIN) + intercept
PIN = 5 dBm, 400 mV rms
PIN = −15 dBm, 40 mV rms
PIN = 0 dBm
+25°C < TA < +85°C
−40°C < TA < +25°C
Rev. A | Page 3 of 20
1.6
−0.1
Typ
Max
6000
Unit
MHz
510||1.01
Ω||pF
25
16
36
40
15
−22
1.88
0.008
0.755
0.082
dB
dB
dB
dB
dBm
dBm
V/V rms
V
V
V
0.0027
0.0024
dB/°C
dB/°C
370||0.80
Ω||pF
26
17
36
40
15
−23
1.86
+0.009
0.748
0.083
dB
dB
dB
dB
dBm
dBm
V/V rms
V
V
V
0.0026
0.0024
2.2
+0.1
dB/°C
dB/°C
�ADL5505
Parameter
RF INPUT (f = 1900 MHz)
Input Impedance
RMS Conversion
Dynamic Range1
±0.25 dB Error2
±0.25 dB Error3
±1 dB Error3
±2 dB Error3
Maximum Input Level
Minimum Input Level
Conversion Gain
Output Intercept4
Output Voltage, High Input Power
Output Voltage, Low Input Power
Temperature Sensitivity
RF INPUT (f = 2600 MHz)
Input Impedance
RMS Conversion
Dynamic Range1
±0.25 dB Error2
±0.25 dB Error3
±1 dB Error3
±2 dB Error3
Maximum Input Level
Minimum Input Level
Conversion Gain
Output Intercept4
Output Voltage, High Input Power
Output Voltage, Low Input Power
Temperature Sensitivity
RF INPUT (f = 3500 MHz)
Input Impedance
RMS Conversion
Dynamic Range1
±0.25 dB Error2
±0.25 dB Error3
±1 dB Error3
±2 dB Error3
Maximum Input Level
Minimum Input Level
Conversion Gain
Output Intercept4
Output Voltage, High Input Power
Output Voltage, Low Input Power
Temperature Sensitivity
Test Conditions
Input RFIN to output VRMS
No termination
Continuous wave (CW) input, −40°C < T A < +85°C
Delta from 25°C
±0.25 dB error3
±1 dB error3
VRMS = (gain × VIN) + intercept
PIN = 5 dBm, 400 mV rms
PIN = −15 dBm, 40 mV rms
PIN = 0 dBm
+25°C < TA < +85°C
−40°C < TA < +25°C
Input RFIN to output VRMS
No termination
Continuous wave (CW) input, −40°C < T A < +85°C
Delta from 25°C
±0.25 dB error3
±1 dB error3
VRMS = (gain × VIN) + intercept
PIN = 5 dBm, 400 mV rms
PIN = −15 dBm, 40 mV rms
PIN = 0 dBm
+25°C < TA < +85°C
−40°C < TA < +25°C
Input RFIN to output VRMS
No termination
Continuous wave (CW) input, −40°C < T A < +85°C
Delta from 25°C
±0.25 dB error3
±1 dB error3
VRMS = (gain × VIN) + intercept
PIN = 5 dBm, 400 mV rms
PIN = −15 dBm, 40 mV rms
PIN = 0 dBm
+25°C < TA < +85°C
−40°C < TA < +25°C
Rev. A | Page 4 of 20
Min
Typ
Max
Unit
270||0.67
Ω||pF
21
16
36
40
15
−22
1.82
0.007
0.727
0.079
dB
dB
dB
dB
dBm
dBm
V/V rms
V
V
V
0.0017
−0.0026
dB/°C
dB/°C
240||0.58
Ω||pF
14
11
35
40
15
−22
1.77
0.005
0.700
0.075
dB
dB
dB
dB
dBm
dBm
V/V rms
V
V
V
0.0016
0.0042
dB/°C
dB/°C
210||0.48
Ω||pF
5
5
33
39
13
−21
1.61
0.001
0.630
0.065
dB
dB
dB
dB
dBm
dBm
V/V rms
V
V
V
0.0046
0.0085
dB/°C
dB/°C
�ADL5505
Parameter
RF INPUT (f = 6000 MHz)
Input Impedance
RMS Conversion
Dynamic Range1
±1 dB Error3
±2 dB Error3
Maximum Input Level
Minimum Input Level
Conversion Gain
Output Intercept4
Output Voltage, High Input Power
Output Voltage, Low Input Power
Temperature Sensitivity
VRMS OUTPUT
Output Offset
Maximum Output Voltage
Available Output Current
Pulse Response Time
Power-Up Response Time 5
POWER SUPPLIES
Operating Range
Quiescent Current 6
Test Conditions
Input RFIN to output VRMS
No termination
Min
Typ
Max
Unit
80||0.42
Ω||pF
23
33
11
−17
0.77
0.002
0.298
0.032
dB
dB
dBm
dBm
V/V rms
V
V
V
0.0103
0.0138
dB/°C
dB/°C
Continuous wave (CW) input, −40°C < T A < +85°C
±0.25 dB error3
±1 dB error3
VRMS = (gain × VIN) + intercept
PIN = 5 dBm, 400 mV rms
PIN = −15 dBm, 40 mV rms
PIN = 0 dBm
+25°C < TA < +85°C
−40°C < TA < +25°C
Pin VRMS
No signal at RFIN
VS = 3.0 V, RLOAD ≥ 10 kΩ
10
2.5
3
3
3
COUT = open, 10 dB step, 10% to 90% of settling level
COUT = open, 0 dBm at RFIN
−40°C < TA < +85°C
No signal at RFIN
The available output swing and, therefore, the dynamic range are altered by the supply voltage; see Figure 8.
Error referred to delta from 25°C response; see Figure 13, Figure 14, Figure 15, Figure 19, Figure 20, and Figure 21.
Error referred to best-fit line at 25°C; see Figure 10, Figure 11, Figure 12, Figure 16, Figure 17, and Figure 18.
4
Calculated using linear regression.
5
The response time is measured from 10% to 90% of settling level; see Figure 30 and Figure 31.
6
Supply current is input level-dependent; see Figure 27.
1
2
3
Rev. A | Page 5 of 20
2.5
1.8
100
mV
V
mA
µs
µs
3.3
V
mA
�ADL5505
ABSOLUTE MAXIMUM RATINGS
Table 2.
Parameter
Supply Voltage, VS
VRMS
RFIN
Equivalent Power, Referred to 50 Ω
Internal Power Dissipation
θJA (WLCSP)
Maximum Junction Temperature
Operating Temperature Range
Storage Temperature Range
Rating
3.5 V
0 V to VS
1.25 V rms
15 dBm
150 mW
260°C/W
125°C
−40°C to +85°C
−65°C to +150°C
Stresses above those listed under Absolute Maximum Ratings
may cause permanent damage to the device. This is a stress
rating only; functional operation of the device at these or any
other conditions above those indicated in the operational
section of this specification is not implied. Exposure to absolute
maximum rating conditions for extended periods may affect
device reliability.
ESD CAUTION
Rev. A | Page 6 of 20
�ADL5505
PIN CONFIGURATION AND FUNCTION DESCRIPTIONS
VPOS
1
4
VRMS
RFIN
2
3
COMM
TOP VIEW
(BALL SIDE DOWN)
Not to Scale
05799-003
ADL5505
Figure 3. Pin Configuration
Table 3. Pin Function Descriptions
Pin No.
1
2
3
4
Mnemonic
VPOS
RFIN
COMM
VRMS
Description
Supply Voltage. The operational range is 2.5 V to 3.3 V.
Signal Input. This pin is internally ac-coupled after internal termination resistance. The nominal input impedance is 500
Device Ground.
RMS Output. This pin is a rail-to-rail voltage output with limited current drive capability. The output has an internal
100 Ω series resistance. High resistive loads and low capacitance loads are recommended to preserve output swing
and allow fast response.
Rev. A | Page 7 of 20
�ADL5505
TYPICAL PERFORMANCE CHARACTERISTICS
TA = 25°C; VS = 3.0 V; COUT = open; light condition ≤ 600 lux; 75 Ω input termination resistor; colors: black = +25°C, blue = −40°C,
red = +85°C; unless otherwise noted.
10
3
450MHz
900MHz
1900MHz
2600MHz
3500MHz
5000MHz
6000MHz
450MHz
900MHz
1900MHz
2600MHz
3500MHz
5000MHz
6000MHz
2
1
ERROR (dB)
OUTPUT (V)
1
0
0.1
–1
–20
–15
–10
–5
0
5
10
15
INPUT (dBm)
–3
–25
05799-004
0.01
–25
1.6
–5
0
5
10
15
10
2.5V
2.7V
3.0V
3.3V
1
OUTPUT (V)
OUTPUT (V)
1.4
–10
Figure 7. Linearity Error vs. Input Level; Frequencies = 450 MHz, 900 MHz,
1900 MHz, 2600 MHz, 3500 MHz, 5000 MHz, 6000 MHz; Supply = 3.0 V
450MHz
900MHz
1900MHz
2600MHz
3500MHz
5000MHz
6000MHz
1.8
–15
INPUT (dBm)
Figure 4. Output vs. Input Level; Frequencies = 450 MHz, 900 MHz, 1900 MHz,
2600 MHz, 3500 MHz, 5000 MHz, 6000 MHz; Supply = 3.0 V
2.0
–20
05799-007
–2
1.2
1.0
0.8
0.1
0.6
0.4
0.1
0.2
0.3
0.4
0.5
0.6
0.7
0.8
0.9
1.0
INPUT (V rms)
0.01
–25
60
1.5
40
1.0
SHUNT RESISTANCE (Ω)
80
INTERCEPT (mV)
2.0
–10
–5
0
5
10
15
Figure 8. Output vs. Input Level; Supplies =
2.5 V, 2.7 V, 3.0 V, and 3.3 V; Frequency = 900 MHz
700
1.4
600
1.2
500
1.0
0.8
400
SHUNT CAPACITANCE
0.6
300
SHUNT RESISTANCE
200
0.4
20
0.2
100
0
0
0
1
2
3
4
5
6
FREQUENCY (GHz)
Figure 6. Conversion Gain and Intercept vs. Frequency; Supply = 3.0 V;
Temperatures = −40°C, +25°C, and +85°C
Rev. A | Page 8 of 20
0
0.5
1.0
1.5
2.0
2.5
0
3.0
FREQUENCY (GHz)
Figure 9. Input Impedance vs. Frequency; Supply = 3.0 V
05799-009
0.5
05799-006
CONVERSION GAIN (V/V rms)
100
–15
INPUT (dBm)
Figure 5. Output vs. Input Level (Linear Scale); Frequencies = 450 MHz, 900 MHz,
1900 MHz, 2600 MHz, 3500 MHz, 5000 MHz, 6000 MHz; Supply = 3.0 V
2.5
–20
SHUNT CAPACITANCE (pF)
0
05799-005
0
05799-008
0.2
�3
2
2
1
1
0
0
–1
–1
–2
–2
–15
–10
–5
0
5
10
15
INPUT (dBm)
–3
–25
2
1
1
ERROR (dB)
2
0
–1
–2
–2
–10
–5
0
5
10
15
INPUT (dBm)
–3
–25
2
1
1
ERROR (dB)
2
0
–1
–2
–2
–10
–5
INPUT (dBm)
0
5
10
15
10
15
–20
–15
–10
–5
0
5
10
15
15
0
–1
–3
–25
05799-012
ERROR (dB)
3
–15
5
Figure 14. Output Delta from +25°C Output Voltage for
50 Devices at −40°C and +85°C; Frequency = 900 MHz
3
–20
0
INPUT (dBm)
Figure 11. Output Temperature Drift from +25°C Linear Reference
for 50 Devices at −40°C, +25°C, and +85°C; Frequency = 900 MHz
–3
–25
–5
0
–1
05799-011
ERROR (dB)
3
–15
–10
Figure 13. Output Delta from +25°C Output Voltage for
50 Devices at −40°C and +85°C; Frequency = 450 MHz
3
–20
–15
INPUT (dBm)
Figure 10. Output Temperature Drift from +25°C Linear Reference
for 50 Devices at −40°C, +25°C, and +85°C; Frequency = 450 MHz
–3
–25
–20
05799-014
–20
05799-015
–3
–25
05799-013
ERROR (dB)
3
05799-010
ERROR (dB)
ADL5505
–20
–15
–10
–5
0
5
10
INPUT (dBm)
Figure 12. Output Temperature Drift from +25°C Linear Reference
for 50 Devices at −40°C, +25°C, and +85°C; Frequency = 1900 MHz
Figure 15. Output Delta from +25°C Output Voltage for
50 Devices at −40°C and +85°C; Frequency = 1900 MHz
Rev. A | Page 9 of 20
�3
2
2
1
1
0
0
–1
–1
–2
–2
–15
–10
–5
0
5
10
15
INPUT (dBm)
–3
–25
2
1
1
ERROR (dB)
2
0
–1
–2
–2
–10
–5
0
5
10
15
INPUT (dBm)
–3
–25
2
1
1
ERROR (dB)
2
0
–1
–2
–2
–10
–5
INPUT (dBm)
0
5
10
15
10
15
–20
–15
–10
–5
0
5
10
15
15
0
–1
05799-018
ERROR (dB)
3
–15
5
Figure 20. Output Delta from +25°C Output Voltage for
50 Devices at −40°C and +85°C; Frequency = 3500 MHz
3
–20
0
INPUT (dBm)
Figure 17. Output Temperature Drift from +25°C Linear Reference
for 50 Devices at −40°C, +25°C, and +85°C; Frequency = 3500 MHz
–3
–25
–5
0
–1
05799-017
ERROR (dB)
3
–15
–10
Figure 19. Output Delta from +25°C Output Voltage for
50 Devices at −40°C and +85°C; Frequency = 2600 MHz
3
–20
–15
INPUT (dBm)
Figure 16. Output Temperature Drift from +25°C Linear Reference
for 50 Devices at −40°C, +25°C, and +85°C; Frequency = 2600 MHz
–3
–25
–20
05799-020
–20
05799-021
–3
–25
05799-019
ERROR (dB)
3
05799-016
ERROR (dB)
ADL5505
Figure 18. Output Temperature Drift from +25°C Linear Reference
for 50 Devices at −40°C, +25°C, and +85°C; Frequency = 6000 MHz
–3
–25
–20
–15
–10
–5
0
5
10
INPUT (dBm)
Figure 21. Output Delta from +25°C Output Voltage for
50 Devices at −40°C and +85°C; Frequency = 6000 MHz
Rev. A | Page 10 of 20
�ADL5505
2
1
–1
–1
–2
–2
–3
–25
–20
–15
–10
–5
0
5
10
15
INPUT (dBm)
–3
–25
3
1 CARRIER
1 CARRIER
1 CARRIER
2 CARRIERS
3 CARRIERS
4 CARRIERS
–1
–2
–2
–15
–10
–5
0
5
10
15
INPUT (dBm)
–3
–25
10
15
–20
–15
–10
–5
0
5
10
Figure 26. Error from CW Linear Reference vs. Input with Various
LTE Reverse Link Waveforms at 2600 MHz, COUT = Open
15
CW
BPSK, 11dB CF
QPSK, 11dB CF
16QAM, 12dB CF
64QAM, 11dB CF
14
13
12
SUPPLY CURRENT (mA)
2
5
INPUT (dBm)
Figure 23. Error from CW Linear Reference vs. Input with Various
W-CDMA Forward Link Waveforms at 2200 MHz, COUT = Open
3
0
0
–1
–20
–5
1
0
–3
–25
–10
CW
16QAM RB1
16QAM RB10
16QAM RB100
QPSK RB1
QPSK RB10
QPSK RB100
2
05799-023
1
0
–1
11
10
9
8
7
6
2.5V
4
3
–2
3.3V
3.0V
COLD
ROOM
HOT
5
2
1
–20
–15
–10
–5
0
5
10
15
INPUT (dBm)
Figure 24. Error from CW Linear Reference vs. Input with Various
802.16 OFDM Waveforms at 3500 MHz, 10 MHz Signal BW, and
256 Subcarriers for All Modulated Signals, COUT = Open
0
05799-024
–3
–25
0
0.1
0.2
0.3
0.4
0.5
0.6
INPUT (V rms)
0.7
0.8
0.9
1.0
05799-027
ERROR (dB)
1
1 WITH 16 DPCH,
1 WITH 32 DPCH,
1 WITH 64 DPCH,
1 WITH 64 DPCH,
1 WITH 64 DPCH,
1 WITH 64 DPCH,
ERROR (dB)
2
MODEL
MODEL
MODEL
MODEL
MODEL
MODEL
–15
Figure 25. Error from CW Linear Reference vs. Input with Various
CDMA2000 Reverse Link Waveforms at 1900 MHz, COUT = Open
3
CW
TEST
TEST
TEST
TEST
TEST
TEST
–20
INPUT (dBm)
Figure 22. Error from CW Linear Reference vs. Input with Various
W-CDMA Reverse Link Waveforms at 900 MHz, COUT = Open
ERROR (dB)
0
05799-025
0
05799-022
ERROR (dB)
1
CW
PICH, 4.7dB
PICH + FCH (9.6kbps), 4.8dB CF
PICH + FCH (9.6kbps) + DCCH, 6.3dB CF
PICH + FCH (9.6kbps) + DCCH + SCH (153.6kbps), 7.6dB CF
PICH + FCH (9.6kbps) + SCH (153.6kbps), 6.7dB
05799-026
2
3
CW
12.2kbps, DPCCH (–5.46dB, 15kSPS) + DPDCH (0dB, 60kSPS), 3.4dB CF
144kbps, DPCCH (–11.48dB, 15kSPS) + DPDCH (0dB, 480kSPS), 3.3dB CF
768kbps, DPCCH (–11.48dB, 15kSPS) + DPDCH1 + 2 (0dB, 960kSPS), 5.8dB CF
DPCCH (–6.02dB, 15kSPS) + DPDCH (–4.08dB, 60kSPS) +
HS-DPCCH (0dB, 15kSPS), 4.91dB CF
DPCCH (–6.02dB,15kSPS) + DPDCH (–11.48dB, 60kSPS) +
HS-DPCCH (0dB, 15kSPS), 5.34dB CF
DPCCH (–6.02dB, 15kSPS) + HS-DPCCH (0dB, 15kSPS), 5.44dB CF
ERROR (dB)
3
Figure 27. Supply Current vs. Input Level; Supplies = 2.5 V, 3.0 V, and 3.3 V;
Frequency = 900 MHz; Temperatures = −40°C, +25°C, and +85°C
Rev. A | Page 11 of 20
�ADL5505
PULSED VPOS
PULSED RFIN
400mV rms RF INPUT
VRMS (150mV/DIV)
250mV rms
160mV rms
70mV rms
250mV rms
160mV rms
70mV rms
VRMS
4μs/DIV
4μs/DIV
Figure 28. Output Response to Various RF Input Pulse Levels; Supply = 3.0 V;
Frequency = 900 MHz; COUT = Open
Figure 30. Output Response to Supply Gating at Various RF Input Levels;
Supply = 3.0 V; Frequency = 900 MHz; COUT = Open
PULSED RFIN
PULSED VPOS
400mV rms RF INPUT
VRMS (150mV/DIV)
400mV rms RF INPUT
VRMS (150mV/DIV)
05799-030
05799-028
VRMS
250mV rms
160mV rms
250mV rms
160mV rms
70mV rms
70mV rms
VRMS
05799-029
10μs/DIV
VRMS
10μs/DIV
Figure 29. Output Response to Various RF Input Pulse Levels; Supply = 3.0 V;
Frequency = 900 MHz; COUT = 100 nF
05799-031
VRMS (150mV/DIV)
400mV rms RF INPUT
Figure 31. Output Response to Supply Gating at Various RF Input Levels;
Supply = 3.0 V; Frequency = 900 MHz; COUT = 100 nF
Rev. A | Page 12 of 20
�ADL5505
CIRCUIT DESCRIPTION
The ADL5505 employs two-stage detection. The critical aspect
of this technical approach is the concept of first stripping the
carrier to reveal the envelope and then performing the required
analog computation of rms.
RMS CIRCUIT DESCRIPTION AND FILTERING
The rms processing is executed using a proprietary translinear
technique. This method is a mathematically accurate rms
computing approach and allows for achieving unprecedented
rms accuracies for complex modulation signals irrespective of
the crest factor of the input signal. An integrating filter capacitor performs the square-domain averaging. The VRMS output
can be expressed as
T2
VRMS = A ×
2
∫ VIN × dt
T1
FILTERING
An important aspect of rms-dc conversion is the need for
averaging (the function is root-mean-square). The on-chip
averaging in the square domain has a corner frequency of
approximately 180 kHz. and is sufficient for common modulation signals, such as CDMA-, CDMA2000-, W-CDMA-, and
QPSK-/QAM-based OFDM (for example, LTE, WLAN, and
WiMAX).
Adequate filtering ensures the accuracy of the rms measurement; however, some ripple or ac residual can still be present on
the dc output. To reduce this ripple, an external shunt capacitor
can be used at the output to form a low-pass filter with the onchip, 100 Ω resistance (see the Selecting the Output Low-Pass
Filter section).
OUTPUT BUFFER
T2 − T1
where A is a scaling parameter that is determined by the on-chip
resistor ratio.
There are no other scaling parameters involved in this computation, which means that the rms output is inherently free from
any sources of error due to temperature, supply, and process
variations.
A buffer takes the internal rms signal and amplifies it accordingly before it is output on the VRMS pin. The output stage
of the rms buffer is a common source PMOS with a resistive
load to provide a rail-to-rail output. The buffer has a 100 Ω
on-chip series resistance on the output, allowing for easy lowpass filtering.
Rev. A | Page 13 of 20
�ADL5505
APPLICATIONS INFORMATION
Resistive Tap RF Input
Figure 32 shows the basic connections for the ADL5505. The
device is powered by a single supply between 2.5 V and 3.3 V,
with a quiescent current of 1.8 mA. The VPOS pin is decoupled
using 100 pF and 0.1 µF capacitors.
Placing a single 75 Ω resistor at the RF input provides a
broadband match of 50 Ω. More precise resistive or reactive
matches can be applied for narrow frequency band use (see
the RF Input Interfacing section).
The ac residual can be reduced further by increasing the output
capacitance, COUT. The combination of the internal 100 Ω outp
ut
resistance and COUT produces a low-pass filter to reduce output
ripple of the VRMS output (see the Selecting the Output LowPass Filter section for more details).
+VS = 2.5V TO 3.3V
0.1µF
1
VPOS
VRMS
ROUT
ADL5505
RFIN
2
RFIN
RF TRANSMISSION LINE
VRMS
4
100pF
Figure 34 shows a technique for coupling the input signal into
the ADL5505 that can be applicable when the input signal is
much larger than the input range of the ADL5505. A series
resistor combines with the input impedance of the ADL5505
to attenuate the input signal. Because this series resistor forms
a divider with the frequency-dependent input impedance, the
apparent gain changes greatly with frequency. However, this
method has the advantage of very little power being tapped off
in RF power transmission applications. If the resistor is large
compared with the impedance of the transmission line, the
VSWR of the system is relatively unaffected.
RSERIES
COUT
ADL5505
COMM
Figure 34. Attenuating the Input Signal
3
05799-032
R10
75Ω
The resistive tap or series resistance, RSERIES, can be expressed as
RSERIES = RIN (1 − 10ATTN/20)/(10ATTN/20)
Figure 32. Basic Connections for ADL5505
RF INPUT INTERFACING
The input impedance of the ADL5505 decreases with increasing
frequency in both its resistive and capacitive components (see
Figure 9). The resistive component varies from 370 Ω at 900 MHz
to about 245 Ω at 2600 MHz.
A number of options exist for input matching. For operation
at multiple frequencies, a 75 Ω shunt to ground, as shown in
Figure 33, provides the best overall match. For use at a single
frequency, a resistive or a reactive match can be used. By plotting
the input impedance on a Smith Chart, the best value for a
resistive match can be calculated. (Both input impedance and
input capacitance can vary by up to ±20% around their nominal
values.) Where VSWR is critical, the match can be improved
with a series inductor placed before the shunt component.
For example, if a power amplifier with a maximum output power
of 28 dBm is matched to the ADL5505 input at 5 dBm, then a
−23 dB attenuation factor is required. At 900 MHz, the input
resistance, RIN, is 370 Ω.
RSERIES = (370 Ω)(1 − 10−23/20)/(10−23/20) = 4856 Ω
ADL5505
05799-033
RFIN
75Ω
(2)
Thus, for an attenuation of −23 dB, a series resistance of appro
ximately 4.87 kΩ (the nearest available standard resistor value)
is needed.
50Ω
ATTN
(1)
where:
RIN is the input impedance of RFIN.
ATTN is the desired attenuation factor in decibels.
RF TRANSMISSION LINE
DIRECTIONAL
COUPLER
RFIN
05799-034
BASIC CONNECTIONS
Figure 33. Input Interfacing to Directional Coupler
Rev. A | Page 14 of 20
�ADL5505
Multiple RF Inputs
Output Swing
Figure 35 shows a technique for combining multiple RF input
signals to the ADL5505. Some applications can share a single
detector for multiple bands. Three 16.5 Ω resistors in a network
T
combine the three 50 Ω terminations (including the ADL5505
with the shunt 75 Ω matching component). The broadband resistive combiner ensures that each port of the T network sees a
50 Ω termination. Because there are only 6 dB of isolation from
one port of the combiner to the other ports, only one band
should be active at a time.
At 900 MHz, the VRMS output voltage is nominally 1.86 × the
input rms voltage (a conversion gain of 1.86 V/V rms). The output
voltage swings from near ground to 2.4 V on a 3.0 V supply.
50Ω
16.5Ω
BAND 2
16.5Ω
RFIN
50Ω
75Ω
16.5Ω
ADL5505
05799-035
DIRECTIONAL
COUPLER
Figure 35. Combining Multiple RF Input Signals
LINEARITY
Because the ADL5505 is a linear responding device, plots of output
voltage vs. input voltage result in a straight line (see Figure 4
and Figure 5) and the dynamic range in decibels (dB) is not
clearly visible. It is more useful to plot the error on a logarithmic scale, as shown in Figure 7. The deviation of the plot from
the ideal straight line characteristic is caused by input stage
clipping at the high end and by signal offsets at the low end.
However, offsets at the low end can be either positive or
negative; therefore, the linearity error vs. input level plots (see
Figure 7) can also trend upwards at the low end. Figure 10 to
Figure 12 and Figure 16 to Figure 18 show error distributions
for a large population of devices at specific frequencies over
temperature.
The ADL5505 has a ±1 dB error detection range of about 30 dB,
as shown in Figure 10 to Figure 12 and Figure 16 to Figure 18.
The error is referred to the best-fit line defined in the linear region
of the output response (see the Device Calibration and Error
Calculation section for more details). Below an input power of
−16 dBm, the response is no longer linear and begins to lose
accuracy. In addition, depending on the supply voltage, saturation
may limit the detection accuracy above +14 dBm. Choose calibration points in the linear region, avoiding the nonlinear
ranges at the high and low extremes.
Figure 36 shows a distribution of the output response vs. the
input for multiple devices. The ADL5505 loses accuracy at low
input powers as the output response begins to fan out. As the
input power is reduced, the spread of the output response
increases along with the error.
10
1
0.01
0.001
It is also apparent in Figure 7 that the error at the lower portion
of the dynamic range tends to shift up as frequency is increased.
This is due to the calibration points chosen: −14 dBm and +8 dBm
(see the Device Calibration and Error Calculation section).
The input impedance of the ADL5505 varies with frequency,
decreasing the actual voltage across the input stage as the
frequency increases and, thus, reducing the conversion gain.
Similarly, conversion gain is less at frequencies near 450 MHz
because of the small on-chip coupling capacitor. The dynamic
range is near constant over frequency, but with a decrease in
conversion gain as frequency is increased.
0.1
0.0001
–25
–20
–15
–10
–5
0
5
10
15
INPUT (dBm)
05799-036
DIRECTIONAL
COUPLER
Output Offset
OUTPUT (V)
BAND 1
Figure 8 shows the output swings of the ADL5505 to a CW input
for various supply voltages. Only at the lowest supply voltages
(2.5 V and 2.7 V) is there a reduction in the dynamic range as
the input headroom decreases.
Figure 36. Output vs. Input Level Distribution of 50 Devices;
Frequency = 900 MHz; Supply = 3.0 V
Although some devices follow the ideal linear response at very
low input powers, not all devices continue the ideal linear regression to a near 0 V y-intercept. Some devices exhibit output
responses that rapidly decrease, and some flatten out.
With no RF signal applied, the ADL5505 has a typical output
offset of 10 mV (with a maximum of 100 mV) on VRMS.
Rev. A | Page 15 of 20
�ADL5505
OUTPUT DRIVE CAPABILITY AND BUFFERING
250
200
RESPONSE TIME (μs)
The ADL5505 is capable of sourcing a VRMS output current of
approximately 3 mA. The output current is sourced through the
on-chip, 100 Ω series resistor; therefore, any load resistor forms
a voltage divider with this on-chip resistance. It is recommended
that the ADL5505 VRMS output drive high resistance loads to
preserve output swing. If an application requires driving a low
resistance load (as well as in cases where increasing the nominal
conversion gain is desired), a buffering circuit is necessary.
100
50
SELECTING THE OUTPUT LOW-PASS FILTER
The output of the ADL5505 can be filtered directly by placing a
capacitor between VRMS (Pin 4) and ground. The combination
of the on-chip, 100 Ω output series resistance and the external
shunt capacitor forms a low-pass filter to reduce the residual ac.
0
1
10
100
1000
COUT CAPACITANCE (nF)
05799-038
The internal filter capacitor of the ADL5505 provides averaging
in the square domain but leaves some residual ac on the output.
Signals with high peak-to-average ratios, such as W-CDMA or
CDMA2000, can produce ac residual levels on the ADL5505
VRMS dc output. To reduce the effects of these low frequency
components in the waveforms, some additional filtering is
required.
Figure 38. Effect of COUT on Response Time
The turn-on time and pulse response are strongly influenced by
the sizes of the output shunt capacitor. Figure 39 shows a plot of
the output response to an RF pulse on the RFIN pin, with a 0.1 µF
output filter capacitor. The falling edge is particularly dependent on
the output shunt capacitance, as shown in Figure 39.
PULSED RFIN
Figure 37 show the effects on the residual ripple vs. the output
filter capacitor value at two communication standards with high
peak-to-average ratios. Note that there is a trade-off between ac
residual and response time. Large output filter capacitances
increase the turn-on and pulse response times, as shown in
Figure 38.
400
150
VRMS (150mV/DIV)
400mV rms RF INPUT
250mV rms
160mV rms
70mV rms
W-CDMA FORWARD LINK (4.6dB CF)
W-CDMA REVERSE LINK (11.7dB CF)
AC RESIDUAL (mV p-p)
VRMS
300
1ms/DIV
250
05799-039
350
Figure 39. Output Response to Various RF Input Pulse Levels; Supply = 3 V;
Frequency = 900 MHz; Square-Domain Filter Open; COUT = 0.1 µF
200
150
100
0
1
10
100
COUT CAPACITANCE (nF)
1000
05799-037
50
To improve the falling edge of the enable and pulse responses,
a resistor can be placed in parallel with the output shunt capacitor.
The added resistance helps to discharge the output filter capacitor.
Although this method reduces the power-off time, the added
load resistor also attenuates the output (see the Output Drive
Capability and Buffering section).
Figure 37. AC Residual vs. COUT, W-CDMA Reverse Link (11.7 dB CF) Waveform
and W-CDMA Forward Link (4.6 dB CF) Waveform
Rev. A | Page 16 of 20
�ADL5505
Once gain and intercept are calculated, an equation can be
written that allows calculation of an (unknown) input power
based on the measured output voltage.
PULSED RFIN
VIN = (VVRMS − Intercept)/Gain
For an ideal (known) input power, the law conformance error of
the measured data can be calculated as
250mV rms
ERROR (dB) =
20 × log [(VVRMS, MEASURED − Intercept)/(Gain × VIN, IDEAL)] (6)
160mV rms
70mV rms
Figure 41 shows a plot of the error at 25°C, the temperature
at which the ADL5505 is calibrated. Note that the error is not 0;
this is because the ADL5505 does not perfectly follow the ideal
linear equation, even within its operating region. The error at
the calibration points is, however, equal to 0 by definition.
05799-040
VRMS
1ms/DIV
(5)
Figure 40. Output Response to Various RF Input Pulse Levels,
Supply = 3 V, Frequency = 900 MHz; Square-Domain Filter Open;
COUT = 0.1 µF with Parallel 1 kΩ
3
POWER CONSUMPTION
2
1
ERROR (dB)
The quiescent current consumption of the ADL5505 varies
linearly with the size of the input signal from approximately
1.8 mA for no signal up to 8.5 mA at an input level of 0.7 V rms
(10 dBm, referred to 50 Ω) as shown in Figure 27. There is
little variation in supply current across power supply voltage
or temperature.
(3)
Intercept = VVRMS1 − (Gain × VIN1)
(4)
–40°C
–2
–3
–25
DEVICE CALIBRATION AND ERROR CALCULATION
Gain = (VVRMS2 − VVRMS1)/(VIN2 − VIN1)
+85°C
0
–1
In applications requiring power saving, it is recommended that the
ADL5505 be disabled while idle by removing the power supply to
the device.
Because slope and intercept vary from device to device, boardlevel calibration must be performed to achieve high accuracy.
In general, calibration is performed by applying two input power
levels to the ADL5505 and measuring the corresponding output
voltages. The calibration points are generally chosen to be within
the linear operating range of the device. The best-fit line is
characterized by calculating the conversion gain (or slope) and
intercept using the following equations:
+25°C
–20
–15
–10
–5
INPUT (dBm)
0
5
10
15
05799-041
VRMS (150mV/DIV)
400mV rms RF INPUT
Figure 41. Error from Linear Reference vs. Input at −40°C, +25°C, and
+85°C vs. +25°C Linear Reference, 1900 MHz Frequency, 3.0 V Supply
Figure 41 also shows error plots for the output voltage at −40°C
and +85°C. These error plots are calculated using the gain and
intercept at 25°C. This is consistent with calibration in a mass
production environment where calibration at temperature is not
practical.
where:
VINx is the rms input voltage to RFIN.
VVRMSx is the voltage output at VRMS.
Rev. A | Page 17 of 20
�ADL5505
CALIBRATION FOR IMPROVED ACCURACY
DRIFT OVER A REDUCED TEMPERATURE RANGE
Another way of presenting the error function of the ADL5505
is shown in Figure 42. In this case, the decibel (dB) error at hot
and cold temperatures is calculated with respect to the transfer
function at ambient temperature. This is a key difference in
comparison to Figure 41, in which the error was calculated
with respect to the ideal linear transfer function at ambient
temperature. When this alternative technique is used, the
error at ambient temperature becomes equal to 0 by definition
(see Figure 42).
Figure 43 shows the error over temperature for a 1.9 GHz input
signal. The error due to drift over temperature consistently
remains within ±0.15 dB and only begins to exceed this limit
when the ambient temperature rises above +65°C and drops
below −20°C. For all frequencies using a reduced temperature
range, higher measurement accuracy is achievable.
3
2
ERROR (dB)
1
+25°C
+85°C
0
–15
–10
–5
INPUT (dBm)
0
5
10
15
05799-042
–2
–20
–30°C
–10°C
+5ºC
+25°C
+45°C
+65°C
+85°C
0.25
0
–0.25
–0.50
–0.75
–1.00
–25
–20
–15
–10
–5
0
5
10
15
INPUT (dBm)
Figure 43. Typical Drift at 1.9 GHz for Various Temperatures
DEVICE HANDLING
The wafer level chip scale package consists of solder bumps
connected to the active side of the die. The part is Pb-free and
RoHS compliant with 95.5% tin, 4.0% silver, and 0.5% copper
solder bump composition. The WLCSP can be mounted on
printed circuit boards using standard surface-mount assembly
techniques; however, caution should be taken to avoid damaging
the die. See the AN-617 Application Note, MicroCSP Wafer
Level Chip Scale Package, for additional information. WLCSP
devices are bumped die; therefore, the exposed die may be
sensitive to light, which can influence specified limits. Lighting
in excess of 600 lux can degrade performance.
LAND PATTERN AND SOLDERING INFORMATION
–40°C
–1
–3
–25
0.50
–40°C
–20°C
0°C
+15°C
+35°C
+55°C
+75°C
05799-043
In some applications, very high accuracy is required at just one
power level or over a reduced input range. For example, in a
wireless transmitter, the accuracy of the high power amplifier
(HPA) is most critical at or close to full power. The ADL5505
offers a tight error distribution in the high input power range,
as shown in Figure 42. The high accuracy range, beginning
around 6 dBm at 1900 MHz, offers 8 dB of ±0.15 dB detection
error over temperature. Multiple point calibration at ambient
temperature in the reduced range offers precise power
measurement with near 0 dB error from −40°C to +85°C.
0.75
ERROR (dB)
This plot is a useful tool for estimating temperature drift at a
particular power level with respect to the (nonideal) response
at ambient temperature. The linearity and dynamic range tend
to be improved artificially with this type of plot because the
ADL5505 does not perfectly follow the ideal linear equation
(especially outside of its linear operating range). Achieving
this level of accuracy in an end application requires calibration
at multiple points in the operating range of the device.
1.00
Figure 42. Error from +25°C Output Voltage at −40°C, +25°C, and +85°C After
Ambient Normalization, 1900 MHz Frequency, 3.0 V Supply
Note that the high accuracy range center varies over frequency
(see Figure 13 to Figure 15 and Figure 19 to Figure 21).
Pad diameters of 0.20 mm are recommended with a solder paste
mask opening of 0.30 mm. For the RF input trace, a trace width
of 0.30 mm is used, which corresponds to a 50 Ω characteristic
impedance for the dielectric material being used (FR4). All traces
going to the pads are tapered down to 0.15 mm. For the RFIN
line, the length of the tapered section is 0.20 mm.
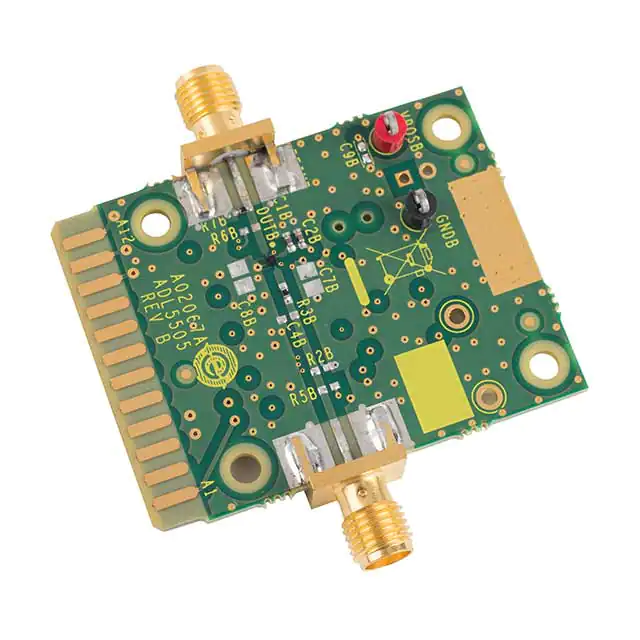
EVALUATION BOARD
Figure 44 shows the schematic of the ADL5505 evaluation board.
The board is powered by a single supply in the 2.5 V to 3.3 V
range. The power supply is decoupled by 100 pF and 0.1 µF
capacitors.
The RF input has a broadband match of 50 Ω using a single
75 Ω resistor at R7B. More precise matching at spot frequencies
is possible (see the RF Input Interfacing section).
Table 4 details the various configuration options of the evaluation
board. Figure 45 shows the layout of the evaluation board.
Rev. A | Page 18 of 20
�ADL5505
C7B
(OPEN)
ADL5505
1
VPOSB
C2B
0.1µF
VRMSB
C4B
(OPEN)
C1B
100pF
2
RFINB
R7B
75Ω
R3B
0Ω
VRMS 4
RFIN
R2B
(OPEN)
R5B
(OPEN)
COMM 3
C8B
(OPEN)
R6B
(OPEN)
05799-044
C9B
(OPEN)
VPOS
(P1 – B12)
05799-045
Figure 44. Evaluation Board Schematic
Figure 45. Layout of Evaluation Board, Component Side
Table 4. Evaluation Board Configuration Options
Component
VPOSB, GNDB
C1B, C2B, C7B, C8B,
C9B
Description
Ground and supply vector pins.
Power supply decoupling. Nominal supply decoupling of 0.1 μF and 100 pF.
R7B
RF input interface. The 75 Ω resistor at R7B combines with the ADL5505 internal
input impedance to give a broadband input impedance of around 50 Ω.
Output filtering. The combination of the internal 100 Ω output resistance and C4B
produce a low-pass filter to reduce output ripple of the VRMS output. The output
can be scaled down using the resistor divider pads, R2B and R3B.
Alternate interface. The end connector, P1, allows access to various ADL5505 signals.
These signal paths are only used during factory test and characterization.
C4B, R2B, R3B
P1, R5B, R6B
Rev. A | Page 19 of 20
Default Condition
Not applicable
C1B = 100 pF (Size 0402)
C2B = 0.1 μF (Size 0402)
C7B = C8B = open (Size 0805)
C9B = open (Size 0402)
R7B = 75 Ω (Size 0402)
R3B = 0 Ω (Size 0402)
R2B = open (Size 0402)
C4B = open (Size 0402)
P1 = not installed
R5B = R6B = open (Size 0402)
�ADL5505
OUTLINE DIMENSIONS
0.830
0.790 SQ
0.750
2
1
A
BALL A1
IDENTIFIER
B
0.40
REF
0.660
0.600
0.540
TOP VIEW
BOTTOM VIEW
(BALL SIDE DOWN)
(BALL SIDE UP)
END VIEW
0.430
0.400
0.370
COPLANARITY
0.05
0.280
0.260
0.240
0.230
0.200
0.170
01-06-2011-A
SEATING
PLANE
Figure 46. 4-Ball Wafer Level Chip Scale Package [WLCSP]
(CB-4-6)
Dimensions shown in millimeters
ORDERING GUIDE
Model 1
ADL5505ACBZ-P7
ADL5505ACBZ-P2
ADL5505-EVALZ
1
Temperature Range
–40°C to +85°C
–40°C to +85°C
Package Description
4-Ball WLCSP, 7” Pocket Tape and Reel
4-Ball WLCSP, 7” Pocket Tape and Reel
Evaluation board
Z = RoHS Compliant Part.
©2010-2011 Analog Devices, Inc. All rights reserved. Trademarks and
registered trademarks are the property of their respective owners.
D05799-0-1/11(A)
Rev. A | Page 20 of 20
Package Option
CB-4-6
CB-4-6
Branding
3R
3R
Ordering Quantity
3,000
250
�


 工商网监
湘ICP备2023018690号
工商网监
湘ICP备2023018690号
