SM72501
www.ti.com
SNIS157C – JANUARY 2011 – REVISED APRIL 2013
SM72501 SolarMagic Precision, CMOS Input, RRIO, Wide Supply Range Amplifier
Check for Samples: SM72501
FEATURES
DESCRIPTION
•
The SM72501 is a low offset voltage, rail-to-rail input
and output precision amplifier with a CMOS input
stage and a wide supply voltage range. The
SM72501 is ideal for sensor interface and other
instrumentation applications.
1
2
•
•
•
•
•
•
•
•
•
•
Renewable Energy Grade
Unless Otherwise noted, Typical values at
VS = 5V
Input Offset Voltage ±200 µV (max)
Input Bias Current ±200 fA
Input Voltage Noise 9 nV/√Hz
CMRR 130 dB
Open Loop Gain 130 dB
Temperature Range −40°C to 125°C
Unity Gain Bandwidth 2.5 MHz
Supply Current (SM72501) 715 µA
Supply Voltage Range 2.7V to 12V
Rail-to-rail Input and Output
The low offset voltage of less than ±200 µV along
with the low input bias current of less than ±1 pA
makes the SM72501 ideal for precision applications.
The SM72501 is built utilizing VIP50 technology,
which allows the combination of a CMOS input stage
and a 12V common mode and supply voltage range.
This makes the SM72501 a great choice in many
applications where conventional CMOS parts cannot
operate under the desired voltage conditions.
The SM72501 has a rail-to-rail input stage that
significantly reduces the CMRR glitch commonly
associated with rail-to-rail input amplifiers. This is
achieved by trimming both sides of the complimentary
input stage, thereby reducing the difference between
the NMOS and PMOS offsets. The output of the
SM72501 swings within 40 mV of either rail to
maximize the signal dynamic range in applications
requiring low supply voltage.
APPLICATIONS
•
•
•
•
•
•
High Impedance Sensor Interface
Battery Powered Instrumentation
High Gain Amplifiers
DAC Buffer
Instrumentation Amplifier
Active Filters
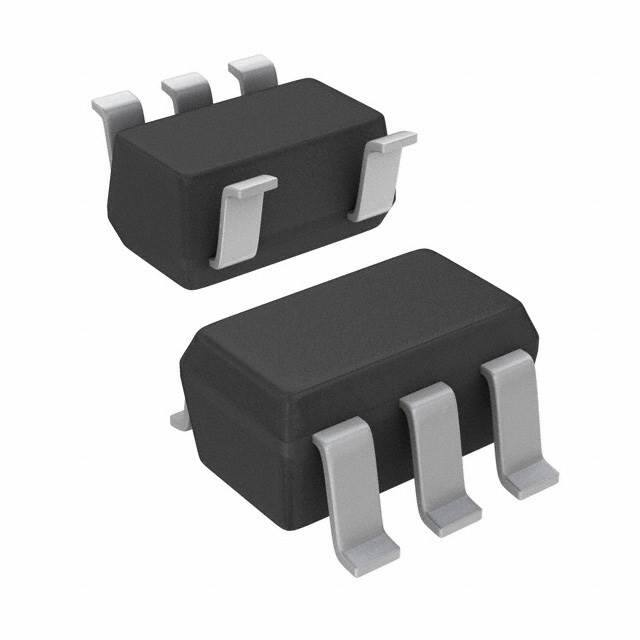
The SM72501 is offered in the space saving 5-Pin
SOT-23. This small package is an ideal solution for
area constrained PC boards and portable electronics.
Typical Application
R
R
V1
V
+
-
RS
I = (V2 ± V1)
A1
RS
+
V
-
V
+
Z
LOAD
-
R
R
V2
A2
+
-
V
Figure 1. Precision Current Source
1
2
Please be aware that an important notice concerning availability, standard warranty, and use in critical applications of
Texas Instruments semiconductor products and disclaimers thereto appears at the end of this data sheet.
All trademarks are the property of their respective owners.
PRODUCTION DATA information is current as of publication date.
Products conform to specifications per the terms of the Texas
Instruments standard warranty. Production processing does not
necessarily include testing of all parameters.
Copyright © 2011–2013, Texas Instruments Incorporated
�SM72501
SNIS157C – JANUARY 2011 – REVISED APRIL 2013
www.ti.com
These devices have limited built-in ESD protection. The leads should be shorted together or the device placed in conductive foam
during storage or handling to prevent electrostatic damage to the MOS gates.
Absolute Maximum Ratings (1) (2)
ESD Tolerance (3)
Human Body Model
Machine Model
Charge-Device Model
±300 mV
Supply Voltage (VS = V+ – V−)
13.2V
V++ 0.3V, V− − 0.3V
Voltage at Input/Output Pins
Input Current
10 mA
−65°C to +150°C
Storage Temperature Range
Junction Temperature (4)
(1)
(2)
(3)
(4)
200V
1000V
VIN Differential
Soldering Information
2000V
+150°C
Infrared or Convection (20 sec)
235°C
Wave Soldering Lead Temp. (10 sec)
260°C
Absolute Maximum Ratings indicate limits beyond which damage to the device may occur. Operating Ratings indicate conditions for
which the device is intended to be functional. For specifications and the test conditions, see the Electrical Characteristics Tables.
If Military/Aerospace specified devices are required, please contact the Texas Instruments Sales Office/ Distributors for availability and
specifications.
Human Body Model, applicable std. MIL-STD-883, Method 3015.7. Machine Model, applicable std. JESD22-A115-A (ESD MM std. of
JEDEC) Field-Induced Charge-Device Model, applicable std. JESD22-C101-C (ESD FICDM std. of JEDEC).
The maximum power dissipation is a function of TJ(MAX), θJA. The maximum allowable power dissipation at any ambient temperature is
PD = (TJ(MAX) – TA)/ θJA. All numbers apply for packages soldered directly onto a PC Board.
Operating Ratings (1)
Temperature Range (2)
−40°C to +125°C
Supply Voltage (VS = V+ – V−)
Package Thermal Resistance (θJA (2))
(1)
(2)
2
2.7V to 12V
5-Pin SOT-23
265°C/W
Absolute Maximum Ratings indicate limits beyond which damage to the device may occur. Operating Ratings indicate conditions for
which the device is intended to be functional. For specifications and the test conditions, see the Electrical Characteristics Tables.
The maximum power dissipation is a function of TJ(MAX), θJA. The maximum allowable power dissipation at any ambient temperature is
PD = (TJ(MAX) – TA)/ θJA. All numbers apply for packages soldered directly onto a PC Board.
Submit Documentation Feedback
Copyright © 2011–2013, Texas Instruments Incorporated
Product Folder Links: SM72501
�SM72501
www.ti.com
SNIS157C – JANUARY 2011 – REVISED APRIL 2013
3V Electrical Characteristics (1)
Unless otherwise specified, all limits are specified for TA = 25°C, V+ = 3V, V− = 0V, VCM = V+/2, and RL > 10 kΩ to V+/2.
Boldface limits apply at the temperature extremes.
Symbol
Parameter
Conditions
Min (2)
Typ (3)
Max (2)
Units
±37
±200
±500
μV
±1
±5
VOS
Input Offset Voltage
TCVOS
Input Offset Voltage Temperature
Drift
See (4)
IB
Input Bias Current
See (4) (5)
−40°C ≤ TA ≤ 85°C
±0.2
±1
±50
See (4) (5)
−40°C ≤ TA ≤ 125°C
±0.2
±1
±400
IOS
Input Offset Current
CMRR
Common Mode Rejection Ratio
0V ≤ VCM ≤ 3V
86
80
130
PSRR
Power Supply Rejection Ratio
2.7V ≤ V+ ≤ 12V, Vo = V+/2
86
82
98
CMVR
Common Mode Voltage Range
CMRR ≥ 80 dB
CMRR ≥ 77 dB
–0.2
–0.2
AVOL
Open Loop Voltage Gain
RL = 2 kΩ
VO = 0.3V to 2.7V
100
96
114
RL = 10 kΩ
VO = 0.2V to 2.8V
100
96
124
VOUT
Output Voltage Swing High
Output Voltage Swing Low
Output Current (6) (7)
IOUT
IS
Supply Current
SR
Slew Rate (8)
GBW
Gain Bandwidth
THD+N
μV/°C
pA
40
fA
dB
dB
3.2
3.2
dB
RL = 2 kΩ to V+/2
40
80
120
RL = 10 kΩ to V+/2
30
40
60
RL = 2 kΩ to V+/2
40
60
80
RL = 10 kΩ to V+/2
20
40
50
Sourcing VO = V+/2
VIN = 100 mV
25
15
42
Sinking VO = V+/2
VIN = −100 mV
25
20
42
0.670
V
mV
from V+
mV
mA
1.0
1.2
mA
AV = +1, VO = 2 VPP
10% to 90%
0.9
V/μs
2.5
MHz
Total Harmonic Distortion + Noise
f = 1 kHz, AV = 1, R.L = 10 kΩ
0.02
%
en
Input Referred Voltage Noise
Density
f = 1 kHz
9
nV/√Hz
in
Input Referred Current Noise
Density
f = 100 kHz
1
(1)
(2)
(3)
(4)
(5)
(6)
(7)
(8)
fA/√Hz
Electrical Table values apply only for factory testing conditions at the temperature indicated. Factory testing conditions result in very
limited self-heating of the device such that TJ = TA. Parametric performance is indicated in the electrical tables under conditions of
internal self-heating where TJ > TA.
Limits are 100% production tested at 25°C. Limits over the operating temperature range are specified through correlations using the
Statistical Quality Control (SQC) method.
Typical values represent the most likely parametric norm as determined at the time of characterization. Actual typical values may vary
over time and will also depend on the application and configuration. The typical values are not tested on shipped production material.
This parameter is specified by design and/or characterization and is not tested in production.
Positive current corresponds to current flowing into the device.
The maximum power dissipation is a function of TJ(MAX), θJA. The maximum allowable power dissipation at any ambient temperature is
PD = (TJ(MAX) – TA)/ θJA. All numbers apply for packages soldered directly onto a PC Board.
The short circuit test is a momentary test.
The number specified is the slower of positive and negative slew rates.
Submit Documentation Feedback
Copyright © 2011–2013, Texas Instruments Incorporated
Product Folder Links: SM72501
3
�SM72501
SNIS157C – JANUARY 2011 – REVISED APRIL 2013
www.ti.com
5V Electrical Characteristics (1)
Unless otherwise specified, all limits are specified for TA = 25°C, V+ = 5V, V− = 0V, VCM = V+/2, and RL > 10 kΩ to V+/2.
Boldface limits apply at the temperature extremes.
Symbol
Parameter
Conditions
Min (2)
Typ (3)
Max (2)
Units
±37
±200
±500
μV
μV/°C
VOS
Input Offset Voltage
TCVOS
Input Offset Voltage Temperature Drift
See (4)
±1
±5
IB
Input Bias Current
See (4) (5)
−40°C ≤ TA ≤ 85°C
±0.2
±1
±50
See (4) (5)
−40°C ≤ TA ≤ 125°C
±0.2
±1
±400
IOS
Input Offset Current
CMRR
Common Mode Rejection Ratio
40
0V ≤ VCM ≤ 5V
+
+
88
83
130
86
82
100
PSRR
Power Supply Rejection Ratio
2.7V ≤ V ≤ 12V, VO = V /2
CMVR
Common Mode Voltage Range
CMRR ≥ 80 dB
CMRR ≥ 78 dB
–0.2
–0.2
AVOL
Open Loop Voltage Gain
RL = 2 kΩ
VO = 0.3V to 4.7V
100
96
119
RL = 10 kΩ
VO = 0.2V to 4.8V
100
96
130
VOUT
Output Voltage Swing High
Output Voltage Swing Low
Output Current (6) (7)
IOUT
IS
SR
Slew Rate
GBW
Gain Bandwidth
THD+N
dB
dB
60
110
130
RL = 10 kΩ to V+/2
40
50
70
RL = 2 kΩ to V+/2
50
80
90
RL = 10 kΩ to V+/2
30
40
50
40
28
66
Sinking VO = V+/2
VIN = −100 mV
40
28
76
0.715
V
dB
RL = 2 kΩ to V+/2
Supply Current
(8)
fA
5.2
5.2
Sourcing VO = V+/2
VIN = 100 mV
pA
mV
from V+
mV
mA
1.0
1.2
mA
AV = +1, VO = 4 VPP
10% to 90%
1.0
Total Harmonic Distortion + Noise
f = 1 kHz, AV = 1, RL = 10 kΩ
0.02
%
en
Input Referred Voltage Noise Density
f = 1 kHz
9
nV/√Hz
in
Input Referred Current Noise Density
f = 100 kHz
1
fA/√Hz
(1)
(2)
(3)
(4)
(5)
(6)
(7)
(8)
4
2.5
V/μs
MHz
Electrical Table values apply only for factory testing conditions at the temperature indicated. Factory testing conditions result in very
limited self-heating of the device such that TJ = TA. Parametric performance is indicated in the electrical tables under conditions of
internal self-heating where TJ > TA.
Limits are 100% production tested at 25°C. Limits over the operating temperature range are specified through correlations using the
Statistical Quality Control (SQC) method.
Typical values represent the most likely parametric norm as determined at the time of characterization. Actual typical values may vary
over time and will also depend on the application and configuration. The typical values are not tested on shipped production material.
This parameter is specified by design and/or characterization and is not tested in production.
Positive current corresponds to current flowing into the device.
The maximum power dissipation is a function of TJ(MAX), θJA. The maximum allowable power dissipation at any ambient temperature is
PD = (TJ(MAX) – TA)/ θJA. All numbers apply for packages soldered directly onto a PC Board.
The short circuit test is a momentary test.
The number specified is the slower of positive and negative slew rates.
Submit Documentation Feedback
Copyright © 2011–2013, Texas Instruments Incorporated
Product Folder Links: SM72501
�SM72501
www.ti.com
SNIS157C – JANUARY 2011 – REVISED APRIL 2013
±5V Electrical Characteristics (1)
Unless otherwise specified, all limits are specified for TA = 25°C, V+ = 5V, V− = −5V, VCM = 0V, and RL > 10 kΩ to 0V.
Boldface limits apply at the temperature extremes.
Symbol
Parameter
Conditions
Min (2)
Typ (3)
Max (2)
Units
±37
±200
±500
μV
μV/°C
VOS
Input Offset Voltage
TCVOS
Input Offset Voltage Temperature Drift
See (4)
±1
±5
IB
Input Bias Current
See (4) (5)
−40°C ≤ TA ≤ 85°C
±0.2
1
±50
See (4) (5)
−40°C ≤ TA ≤ 125°C
±0.2
1
±400
IOS
Input Offset Current
CMRR
Common Mode Rejection Ratio
40
−5V ≤ VCM ≤ 5V
+
92
88
138
86
82
98
PSRR
Power Supply Rejection Ratio
2.7V ≤ V ≤ 12V, VO = 0V
CMVR
Common Mode Voltage Range
CMRR ≥ 80 dB
CMRR ≥ 78 dB
−5.2
−5.2
AVOL
Open Loop Voltage Gain
RL = 2 kΩ
VO = −4.7V to 4.7V
100
98
121
RL = 10 kΩ
VO = −4.8V to 4.8V
100
98
134
VOUT
Output Voltage Swing High
Output Voltage Swing Low
Output Current (6) (7)
IOUT
IS
SR
Slew Rate
GBW
Gain Bandwidth
THD+N
fA
dB
dB
5.2
5.2
90
150
170
RL = 10 kΩ to 0V
40
80
100
RL = 2 kΩ to 0V
90
130
150
RL = 10 kΩ to 0V
40
50
60
Sourcing VO = 0V
VIN = 100 mV
50
35
86
Sinking VO = 0V
VIN = −100 mV
50
35
84
0.790
V
dB
RL = 2 kΩ to 0V
Supply Current
(8)
pA
mV
from V+
mV
from V–
mA
1.1
1.3
mA
AV = +1, VO = 9 VPP
10% to 90%
1.1
V/μs
2.5
MHz
Total Harmonic Distortion + Noise
f = 1 kHz, AV = 1, RL = 10 kΩ
0.02
%
en
Input Referred Voltage Noise Density
f = 1 kHz
9
nV/√Hz
in
Input Referred Current Noise Density
f = 100 kHz
1
fA/√Hz
(1)
(2)
(3)
(4)
(5)
(6)
(7)
(8)
Electrical Table values apply only for factory testing conditions at the temperature indicated. Factory testing conditions result in very
limited self-heating of the device such that TJ = TA. Parametric performance is indicated in the electrical tables under conditions of
internal self-heating where TJ > TA.
Limits are 100% production tested at 25°C. Limits over the operating temperature range are specified through correlations using the
Statistical Quality Control (SQC) method.
Typical values represent the most likely parametric norm as determined at the time of characterization. Actual typical values may vary
over time and will also depend on the application and configuration. The typical values are not tested on shipped production material.
This parameter is specified by design and/or characterization and is not tested in production.
Positive current corresponds to current flowing into the device.
The maximum power dissipation is a function of TJ(MAX), θJA. The maximum allowable power dissipation at any ambient temperature is
PD = (TJ(MAX) – TA)/ θJA. All numbers apply for packages soldered directly onto a PC Board.
The short circuit test is a momentary test.
The number specified is the slower of positive and negative slew rates.
Submit Documentation Feedback
Copyright © 2011–2013, Texas Instruments Incorporated
Product Folder Links: SM72501
5
�SM72501
SNIS157C – JANUARY 2011 – REVISED APRIL 2013
www.ti.com
Connection Diagram
OUT
-
V
5
1
2
+
IN+
+
V
3
4
IN-
Figure 2. 5-Pin SOT-23 - Top View
See DBV Package
6
Submit Documentation Feedback
Copyright © 2011–2013, Texas Instruments Incorporated
Product Folder Links: SM72501
�SM72501
www.ti.com
SNIS157C – JANUARY 2011 – REVISED APRIL 2013
Typical Performance Characteristics
Unless otherwise noted: TA = 25°C, VCM = VS/2, RL > 10 kΩ.
Offset Voltage Distribution
TCVOS Distribution
20
25
VS = 3V
VS = 3V
-40°C d TA d 125°C
16
PERCENTAGE (%)
PERCENTAGE (%)
20
TA = 25°C
15
10
12
8
4
5
0
-200
0
-100
0
100
200
-3
-2
-1
0
TCVOS (PV/°C)
Figure 3.
Figure 4.
Offset Voltage Distribution
3
TCVOS Distribution
VS = 5V
VS = 5V
TA = 25°C
-40°C d TA d 125°C
16
PERCENTAGE (%)
20
PERCENTAGE (%)
2
20
25
15
10
12
8
4
5
0
-200
0
-100
0
100
OFFSET VOLTAGE (PV)
200
-3
-2
-1
0
1
2
3
TCVOS (PV/°C)
Figure 5.
Figure 6.
Offset Voltage Distribution
TCVOS Distribution
20
25
VS = 10V
VS = 10V
-40°C d TA d 125°C
TA = 25°C
16
PERCENTAGE (%)
20
PERCENTAGE (%)
1
OFFSET VOLTAGE (PV)
15
10
12
4
5
0
-200
8
0
-100
0
100
OFFSET VOLTAGE (PV)
200
-3
-2
-1
0
1
2
3
TCVOS (PV/°C)
Figure 7.
Figure 8.
Submit Documentation Feedback
Copyright © 2011–2013, Texas Instruments Incorporated
Product Folder Links: SM72501
7
�SM72501
SNIS157C – JANUARY 2011 – REVISED APRIL 2013
www.ti.com
Typical Performance Characteristics (continued)
Unless otherwise noted: TA = 25°C, VCM = VS/2, RL > 10 kΩ.
CMRR
vs.
Frequency
200
0
150
-20
VS = 3V
100
-40
VS = 3V
50
VS = 5V
CMRR (dB)
OFFSET VOLTAGE (PV)
Offset Voltage
vs.
Temperature
0
-50
VS = 5V
VS = 10V
-80
-100
-100
VS = 10V
-120
-150
-200
-140
-40 -20
0
20
40
60
80 100 120125
10
Figure 9.
Figure 10.
Offset Voltage
vs.
Supply Voltage
Offset Voltage
vs.
VCM
200
200
150
150
1M
VS = 3V
100
-40°C
50
0
25°C
-50
-100
125°C
-40°C
100
50
25°C
0
-50
125°C
-100
-150
-200
2
4
6
8
10
-200
-0.5
12
0
0.5 1
1.5
2
2.5
3
3.5
VCM (V)
SUPPLY VOLTAGE (V)
Figure 11.
Figure 12.
Offset Voltage
vs.
VCM
Offset Voltage
vs.
VCM
200
200
VS = 10V
VS = 5V
150
150
OFFSET VOLTAGE (PV)
OFFSET VOLTAGE (PV)
100k
FREQUENCY (Hz)
-150
100
-40°C
50
0
25°C
-50
-100
125°C
-150
100
-40°C
50
0
25°C
-50
-100
-150
125°C
-200
-200
-1
0
1
2
3
4
5
6
VCM (V)
-1 0
1
2
3
4
5
6
7
8
9 10 11
VCM (V)
Figure 13.
8
10k
1k
100
TEMPERATURE (°C)
OFFSET VOLTAGE (PV)
OFFSET VOLTAGE (PV)
-60
Figure 14.
Submit Documentation Feedback
Copyright © 2011–2013, Texas Instruments Incorporated
Product Folder Links: SM72501
�SM72501
www.ti.com
SNIS157C – JANUARY 2011 – REVISED APRIL 2013
Typical Performance Characteristics (continued)
Unless otherwise noted: TA = 25°C, VCM = VS/2, RL > 10 kΩ.
Input Bias Current
vs.
VCM
Input Bias Current
vs.
VCM
300
200
VS = 3V
VS = 3V
200
100
IBIAS (pA)
IBIAS (fA)
100
-40°C
0
85°C
0
-100
-100
-200
125°C
25°C
-300
-200
0
0.5
1
2
1.5
2.5
0
3
0.5
1.5
1
2
Figure 15.
Figure 16.
Input Bias Current
vs.
VCM
Input Bias Current
vs.
VCM
3
300
300
VS = 5V
VS = 5V
200
200
100
100
IBIAS (pA)
IBIAS (fA)
2.5
VCM (V)
VCM (V)
-40°C
0
85°C
0
-100
-100
-200
-200
25°C
125°C
-300
-300
0
1
2
3
4
0
5
1
2
3
4
5
VCM (V)
VCM (V)
Figure 17.
Figure 18.
Input Bias Current
vs.
VCM
Input Bias Current
vs.
VCM
300
500
VS = 10V
VS = 10V
200
250
IBIAS (pA)
IBIAS (fA)
100
-40°C
0
85°C
0
-100
-250
-200
25°C
125°C
-500
-300
0
2
4
6
8
10
VCM (V)
0
2
4
6
8
10
VCM (V)
Figure 19.
Figure 20.
Submit Documentation Feedback
Copyright © 2011–2013, Texas Instruments Incorporated
Product Folder Links: SM72501
9
�SM72501
SNIS157C – JANUARY 2011 – REVISED APRIL 2013
www.ti.com
Typical Performance Characteristics (continued)
Unless otherwise noted: TA = 25°C, VCM = VS/2, RL > 10 kΩ.
PSRR
vs.
Frequency
120
Supply Current
vs.
Supply Voltage (Per Channel)
1.2
VS = 10V
VS = 5V
1
SUPPLY CURRENT (mA)
100
VS = 3V
+PSRR
PSRR (dB)
80
VS = 10V
60
VS = 5V
VS = 3V
40
20
125°C
25°C
0.8
0.6
-40°C
0.4
0.2
-PSRR
0
0
10
10k
1k
100
100k
1M
2
4
FREQUENCY (Hz)
6
8
10
12
SUPPLY VOLTAGE (V)
Figure 21.
Figure 22.
Sinking Current
vs.
Supply Voltage
Sourcing Current
vs.
Supply Voltage
120
120
-40°C
100
-40°C
100
25°C
25°C
60
ISOURCE (mA)
ISINK (mA)
80
125°C
40
20
40
0
2
4
6
8
10
12
2
6
8
Figure 23.
Figure 24.
Output Voltage
vs.
Output Current
Slew Rate
vs.
Supply Voltage
1.5
TA = -40°C, 25°C, 125C
VIN = 2 VPP
(V ) -2
|
3V
2
SLEW RATE (V/Ps)
1.3
+
12
AV = +1
1.4
+
(V ) -1
|
10
SUPPLY VOLTAGE (V)
+
RL = 10 k:
FALLING EDGE
1.2
CL = 10 pF
1.1
1
0.9
RISING EDGE
0.8
0.7
1
VS = 3V, 5V, 10V
0
4
SUPPLY VOLTAGE (V)
V
VOUT FROM RAIL (V)
125°C
60
20
0
0.6
0.5
0
20
40
60
80
100
OUTPUT CURRENT (mA)
2
4
6
8
10
12
SUPPLY VOLTAGE (V)
Figure 25.
10
80
Figure 26.
Submit Documentation Feedback
Copyright © 2011–2013, Texas Instruments Incorporated
Product Folder Links: SM72501
�SM72501
www.ti.com
SNIS157C – JANUARY 2011 – REVISED APRIL 2013
Typical Performance Characteristics (continued)
Unless otherwise noted: TA = 25°C, VCM = VS/2, RL > 10 kΩ.
80
Open Loop Frequency Response
100
225
GAIN
60
180
80
135
60
90
40
CL = 20 pF, 50 pF, 100 pF 180
RL = 10 k:
VS = 10V
125°C
45
125°C
0
0
25°C
-20 VS = 5V
C = 20 pF
-40 L
RL = 10 k:
-60
100
10k
1k
-40°C
-45
GAIN (dB)
20
25°C
PHASE
PHASE (°)
GAIN (dB)
-40°C
40
CL = 20 pF
PHASE
20
-45
VS = 3V
-40
-90
CL = 100 pF
100k
1M
-135
10M 100M
-60
100
1k
10k
100k
1M
-135
10M 100M
FREQUENCY (Hz)
Figure 27.
Figure 28.
Large Signal Step Response
Small Signal Step Response
20 mV/DIV
500 mV/DIV
90
0
FREQUENCY (Hz)
VS = 5V
f = 10 kHz
VS = 5V
f = 10 kHz
AV = +1
AV = +1
VIN = 2 VPP
VIN = 100 mVPP
RL = 10 k:
RL = 10 k:
CL = 10 pF
CL = 10 pF
10 Ps/DIV
10 Ps/DIV
Figure 29.
Figure 30.
Large Signal Step Response
Small Signal Step Response
200 mV/DIV
1V/DIV
135
45
0
-20
-90
225
VS = 3V, 5V, 10V
GAIN
PHASE (°)
Open Loop Frequency Response
100
VS = 5V
f = 10 kHz
VS = 5V
f = 10 kHz
AV = +10
AV = +10
VIN = 400 mVPP
VIN = 100 mVPP
RL = 10 k:
RL = 10 k:
CL = 10 pF
CL = 10 pF
10 Ps/DIV
10 Ps/DIV
Figure 31.
Figure 32.
Submit Documentation Feedback
Copyright © 2011–2013, Texas Instruments Incorporated
Product Folder Links: SM72501
11
�SM72501
SNIS157C – JANUARY 2011 – REVISED APRIL 2013
www.ti.com
Typical Performance Characteristics (continued)
Unless otherwise noted: TA = 25°C, VCM = VS/2, RL > 10 kΩ.
Input Voltage Noise
vs.
Frequency
Open Loop Gain
vs.
Output Voltage Swing
150
VS = 10V
100
80
VS = 3V
60
VS = 5V
40
130
120
RL = 10 k:
110
VS = 3V
100
90
80
20
1
10
RL = 2 k:
70
VS = 10V
0
100
1k
10k
60
500
100k
FREQUENCY (Hz)
Output Swing Low
vs.
Supply Voltage
0
50
RL = 10 k:
25°C
40
125°C
30
VOUT FROM RAIL (mV)
VOUT FROM RAIL (mV)
100
Output Swing High
vs.
Supply Voltage
-40°C
20
10
2
4
6
8
10
-40°C
30
25°C
125°C
20
10
0
12
2
4
6
8
10
SUPPLY VOLTAGE (V)
SUPPLY VOLTAGE (V)
Figure 35.
Figure 36.
Output Swing High
vs.
Supply Voltage
Output Swing Low
vs.
Supply Voltage
100
12
100
RL = 2 k:
RL = 2 k:
25°C
25°C
80
80
125°C
VOUT FROM RAIL (mV)
VOUT FROM RAIL (mV)
200
Figure 34.
40
60
-40°C
40
20
0
300
Figure 33.
RL = 10 k:
0
400
OUTPUT SWING FROM RAIL (mV)
50
12
VS = 5V
140
OPEN LOOP GAIN (dB)
INPUT REFERRED VOLTAGE NOISE
(nV/ Hz)
120
2
4
6
8
10
12
125°C
60
-40°C
40
20
0
2
4
6
8
SUPPLY VOLTAGE (V)
SUPPLY VOLTAGE (V)
Figure 37.
Figure 38.
Submit Documentation Feedback
10
12
Copyright © 2011–2013, Texas Instruments Incorporated
Product Folder Links: SM72501
�SM72501
www.ti.com
SNIS157C – JANUARY 2011 – REVISED APRIL 2013
Typical Performance Characteristics (continued)
Unless otherwise noted: TA = 25°C, VCM = VS/2, RL > 10 kΩ.
THD+N
vs.
Frequency
THD+N
vs.
Output Voltage
1
1
VS = 5V
f = 1 kHz
VS = 5V
VO = 4.5 VPP
RL = 100 k:
RL = 100 k:
0.1
THD+N (%)
0.1
AV = +10
THD+N (%)
AV = +10
0.01
0.01
AV = +1
AV = +1
0.001
10
100
1k
10k
100k
0.001
0.001
0.01
0.1
FREQUENCY (Hz)
VOUT (V)
Figure 39.
Figure 40.
1
10
Submit Documentation Feedback
Copyright © 2011–2013, Texas Instruments Incorporated
Product Folder Links: SM72501
13
�SM72501
SNIS157C – JANUARY 2011 – REVISED APRIL 2013
www.ti.com
APPLICATION INFORMATION
SM72501
The SM72501 is a low offset voltage, rail-to-rail input and output precision amplifier with a CMOS input stage and
wide supply voltage range of 2.7V to 12V. The SM72501 has a very low input bias current of only ±200 fA at
room temperature.
The wide supply voltage range of 2.7V to 12V over the extensive temperature range of −40°C to 125°C makes
the SM72501 an excellent choice for low voltage precision applications with extensive temperature requirements.
The SM72501 has only ±37 μV of typical input referred offset voltage and this offset is specified to be less than
±500 μV over temperature. This minimal offset voltage allows more accurate signal detection and amplification in
precision applications.
The low input bias current of only ±200 fA along with the low input referred voltage noise of 9 nV/√Hz gives the
SM72501 superiority for use in sensor applications. Lower levels of noise from the SM72501 means better signal
fidelity and a higher signal-to-noise ratio.
Technical support and extensive characterization data is available for sensitive applications or applications with a
constrained error budget.
The SM72501 is offered in the space saving 5-Pin SOT-23. This small package is an ideal solution for area
constrained PC boards and portable electronics.
CAPACITIVE LOAD
The SM72501 can be connected as a non-inverting unity gain follower. This configuration is the most sensitive to
capacitive loading.
The combination of a capacitive load placed on the output of an amplifier along with the amplifier's output
impedance creates a phase lag which in turn reduces the phase margin of the amplifier. If the phase margin is
significantly reduced, the response will be either underdamped or it will oscillate.
In order to drive heavier capacitive loads, an isolation resistor, RISO, in Figure 41 should be used. By using this
isolation resistor, the capacitive load is isolated from the amplifier's output, and hence, the pole caused by CL is
no longer in the feedback loop. The larger the value of RISO, the more stable the output voltage will be. If values
of RISO are sufficiently large, the feedback loop will be stable, independent of the value of CL. However, larger
values of RISO result in reduced output swing and reduced output current drive.
Figure 41. Isolating Capacitive Load
INPUT CAPACITANCE
CMOS input stages inherently have low input bias current and higher input referred voltage noise. The SM72501
enhances this performance by having the low input bias current of only ±200 fA, as well as, a very low input
referred voltage noise of 9 nV/√Hz. In order to achieve this a larger input stage has been used. This larger input
stage increases the input capacitance of the SM72501. The typical value of this input capacitance, CIN, for the
SM72501 is 25 pF. The input capacitance will interact with other impedances such as gain and feedback
resistors, which are seen on the inputs of the amplifier, to form a pole. This pole will have little or no effect on the
output of the amplifier at low frequencies and DC conditions, but will play a bigger role as the frequency
increases. At higher frequencies, the presence of this pole will decrease phase margin and will also cause gain
peaking. In order to compensate for the input capacitance, care must be taken in choosing the feedback
resistors. In addition to being selective in picking values for the feedback resistor, a capacitor can be added to
the feedback path to increase stability.
The DC gain of the circuit shown in Figure 42 is simply –R2/R1.
14
Submit Documentation Feedback
Copyright © 2011–2013, Texas Instruments Incorporated
Product Folder Links: SM72501
�SM72501
www.ti.com
SNIS157C – JANUARY 2011 – REVISED APRIL 2013
CF
R2
R1
+
VIN
CIN
+
+
-
-
AV = -
VOUT
VIN
=-
VOUT
R2
R1
Figure 42. Compensating for Input Capacitance
For the time being, ignore CF. The AC gain of the circuit in Figure 42 can be calculated as follows:
-R2/R1
(s) =
1+
s2
s
+
§ A0 R 1
§ A0
¨
¨C R
© R1 + R2
© IN 2
§
¨
©
VIN
§
¨
©
VOUT
(1)
This equation is rearranged to find the location of the two poles:
-1
2CIN
1
1
+
r
R1
R2
§1
1
+
¨
R2
© R1
§
¨
©
P1,2 =
2
-
4 A0CIN
R2
(2)
As shown in Equation 2, as values of R1 and R2 are increased, the magnitude of the poles is reduced, which in
turn decreases the bandwidth of the amplifier. Whenever possible, it is best to choose smaller feedback resistors.
Figure 43 shows the effect of the feedback resistor on the bandwidth of the SM72501.
2
VS = 5V
CF = 0 pF
NORMALIZED GAIN (dB)
0
AV = -1
-2
R1 = R2 = 100 k:
-4
R1 = R2 = 30 k:
-6
R1 = R2 = 10 k:
-8
R1 = R2 = 1 k:
-10
1k
10k
100k
1M
10M
FREQUENCY (Hz)
Figure 43. Closed Loop Gain vs. Frequency
Equation 2 has two poles. In most cases, it is the presence of pairs of poles that causes gain peaking. In order to
eliminate this effect, the poles should be placed in Butterworth position, since poles in Butterworth position do not
cause gain peaking. To achieve a Butterworth pair, the quantity under the square root in Equation 2 should be
set to equal −1. Using this fact and the relation between R1 and R2, R2 = −AV R1, the optimum value for R1 can
be found. This is shown in Equation 3. If R1 is chosen to be larger than this optimum value, gain peaking will
occur.
R1 <
(1 - AV)
2
2A0AVCIN
(3)
In Figure 42, CF is added to compensate for input capacitance and to increase stability. Additionally, CF reduces
or eliminates the gain peaking that can be caused by having a larger feedback resistor. Figure 44 shows how CF
reduces gain peaking.
Submit Documentation Feedback
Copyright © 2011–2013, Texas Instruments Incorporated
Product Folder Links: SM72501
15
�SM72501
SNIS157C – JANUARY 2011 – REVISED APRIL 2013
www.ti.com
2
CF = 0 pF
NORMALIZED GAIN (dB)
0
CF = 1 pF
-2
CF = 5 pF
-4
CF = 3 pF
-6
VS = 5V
-8
R1 = R2 = 100 k:
AV = -1
-10
1k
10k
100k
1M
10M
FREQUENCY (Hz)
Figure 44. Closed Loop Gain vs. Frequency with Compensation
DIODES BETWEEN THE INPUTS
The SM72501 has a set of anti-parallel diodes between the input pins, as shown in Figure 45. These diodes are
present to protect the input stage of the amplifier. At the same time, they limit the amount of differential input
voltage that is allowed on the input pins. A differential signal larger than one diode voltage drop might damage
the diodes. The differential signal between the inputs needs to be limited to ±300 mV or the input current needs
to be limited to ±10 mA.
V
V
D1
ESD
IN
+
+
R1
ESD
R2
+
IN
ESD
ESD
D2
V
-
-
-
V
Figure 45. Input of SM72501
PRECISION CURRENT SOURCE
The SM72501 can be used as a precision current source in many different applications. Figure 46 shows a
typical precision current source. This circuit implements a precision voltage controlled current source. Amplifier
A1 is a differential amplifier that uses the voltage drop across RS as the feedback signal. Amplifier A2 is a buffer
that eliminates the error current from the load side of the RS resistor that would flow in the feedback resistor if it
were connected to the load side of the RS resistor. In general, the circuit is stable as long as the closed loop
bandwidth of amplifier A2 is greater then the closed loop bandwidth of amplifier A1. Note that if A1 and A2 are
the same type of amplifiers, then the feedback around A1 will reduce its bandwidth compared to A2.
16
Submit Documentation Feedback
Copyright © 2011–2013, Texas Instruments Incorporated
Product Folder Links: SM72501
�SM72501
www.ti.com
SNIS157C – JANUARY 2011 – REVISED APRIL 2013
R
R
V1
V
+
-
RS
I = (V2 ± V1)
A1
RS
+
V
-
V
+
Z
LOAD
-
R
R
V2
A2
+
-
V
Figure 46. Precision Current Source
The equation for output current can be derived as follows:
V2R
R+R
+
(V0 ± IRS)R
R+R
=
V1R
R+R
+
V0R
R+R
(4)
Solving for the current I results in the following equation:
I=
V2 ± V1
RS
(5)
LOW INPUT VOLTAGE NOISE
The SM72501 has a very low input voltage noise of 9 nV/ . This input voltage noise can be further reduced by
placing N amplifiers in parallel as shown in Figure 47. The total voltage noise on the output of this circuit is
divided by the square root of the number of amplifiers used in this parallel combination. This is because each
individual amplifier acts as an independent noise source, and the average noise of independent sources is the
quadrature sum of the independent sources divided by the number of sources. For N identical amplifiers, this
means:
REDUCED INPUT VOLTAGE NOISE =
1
N
en1+en2+
=
1
N
Nen =
=
2
2
2
1
2
+enN
N
en
N
en
N
(6)
Figure 47 shows a schematic of this input voltage noise reduction circuit. Typical resistor values are:
RG = 10Ω, RF = 1 kΩ, and RO = 1 kΩ.
Submit Documentation Feedback
Copyright © 2011–2013, Texas Instruments Incorporated
Product Folder Links: SM72501
17
�SM72501
SNIS157C – JANUARY 2011 – REVISED APRIL 2013
www.ti.com
+
V
+
-
VIN
VOUT
-
RG
RO
V
RF
+
V
+
RG
V
-
RO
RF
+
V
+
RG
V
-
RO
RF
+
V
+
RG
V
-
RO
RF
Figure 47. Noise Reduction Circuit
TOTAL NOISE CONTRIBUTION
The SM72501 has very low input bias current, very low input current noise, and very low input voltage noise. As
a result, these amplifiers are ideal choices for circuits with high impedance sensor applications.
Figure 48 shows the typical input noise of the SM72501 as a function of source resistance where:
en denotes the input referred voltage noise
ei is the voltage drop across source resistance due to input referred current noise or ei = RS * in
et shows the thermal noise of the source resistance
eni shows the total noise on the input.
Where:
eni =
2
2
2
en + ei + et
(7)
The input current noise of the SM72501 is so low that it will not become the dominant factor in the total noise
unless source resistance exceeds 300 MΩ, which is an unrealistically high value.
As is evident in Figure 48, at lower RS values, total noise is dominated by the amplifier's input voltage noise.
Once RS is larger than a few kilo-Ohms, then the dominant noise factor becomes the thermal noise of RS. As
mentioned before, the current noise will not be the dominant noise factor for any practical application.
18
Submit Documentation Feedback
Copyright © 2011–2013, Texas Instruments Incorporated
Product Folder Links: SM72501
�SM72501
www.ti.com
SNIS157C – JANUARY 2011 – REVISED APRIL 2013
VOLTAGE NOISE DENSITY (nV/ Hz)
1000
100
eni
en
10
et
ei
1
0.1
10
100
10k
1k
100k
1M
10M
RS (:)
Figure 48. Total Input Noise
HIGH IMPEDANCE SENSOR INTERFACE
Many sensors have high source impedances that may range up to 10 MΩ. The output signal of sensors often
needs to be amplified or otherwise conditioned by means of an amplifier. The input bias current of this amplifier
can load the sensor's output and cause a voltage drop across the source resistance as shown in Figure 49,
where VIN+ = VS – IBIAS*RS
The last term, IBIAS*RS, shows the voltage drop across RS. To prevent errors introduced to the system due to this
voltage, an op amp with very low input bias current must be used with high impedance sensors. This is to keep
the error contribution by IBIAS*RS less than the input voltage noise of the amplifier, so that it will not become the
dominant noise factor.
SENSOR
+
V
IB
RS
VIN+
+
VS
+
-
-
V
Figure 49. Noise Due to IBIAS
pH electrodes are very high impedance sensors. As their name indicates, they are used to measure the pH of a
solution. They usually do this by generating an output voltage which is proportional to the pH of the solution. pH
electrodes are calibrated so that they have zero output for a neutral solution, pH = 7, and positive and negative
voltages for acidic or alkaline solutions. This means that the output of a pH electrode is bipolar and has to be
level shifted to be used in a single supply system. The rate of change of this voltage is usually shown in mV/pH
and is different for different pH sensors. Temperature is also an important factor in a pH electrode reading. The
output voltage of the senor will change with temperature.
Figure 50 shows a typical output voltage spectrum of a pH electrode. Note that the exact values of output voltage
will be different for different sensors. In this example, the pH electrode has an output voltage of 59.15 mV/pH at
25°C.
ACID
0
+414 mV
2
BASE
4
7
10
+177 mV
0 mV
-177 mV
12
14 pH
-414 mV
Figure 50. Output Voltage of a pH Electrode
The temperature dependence of a typical pH electrode is shown in Figure 51. As is evident, the output voltage
changes with changes in temperature.
Submit Documentation Feedback
Copyright © 2011–2013, Texas Instruments Incorporated
Product Folder Links: SM72501
19
�SM72501
SNIS157C – JANUARY 2011 – REVISED APRIL 2013
www.ti.com
mV
600
10°C (74.04 mV/pH)
500
400
25°C (59.15 mV/pH)
300
200
100
2
4
12
10
8
14
pH
0
-100
1
3
5
7
9
11
13
-200
-300
-400
-500
0°C (54.20 mV/pH)
-600
Figure 51. Temperature Dependence of a pH Electrode
The schematic shown in Figure 52 is a typical circuit which can be used for pH measurement. The LM35 is a
precision integrated circuit temperature sensor. This sensor is differentiated from similar products because it has
an output voltage linearly proportional to Celcius measurement, without the need to convert the temperature to
Kelvin. The LM35 is used to measure the temperature of the solution and feeds this reading to the Analog to
Digital Converter, ADC. This information is used by the ADC to calculate the temperature effects on the pH
readings. The LM35 needs to have a resistor, RT in Figure 52, to –V+ in order to be able to read temperatures
below 0°C. RT is not needed if temperatures are not expected to go below zero.
The output of pH electrodes is usually large enough that it does not require much amplification; however, due to
the very high impedance, the output of a pH electrode needs to be buffered before it can go to an ADC. Since
most ADCs are operated on single supply, the output of the pH electrode also needs to be level shifted. Amplifier
A1 buffers the output of the pH electrode with a moderate gain of +2, while A2 provides the level shifting. VOUT at
the output of A2 is given by: VOUT = −2VpH + 1.024V.
The LM4140A is a precision, low noise, voltage reference used to provide the level shift needed. The ADC used
in this application is the ADC12032 which is a 12-bit, 2 channel converter with multiplexers on the inputs and a
serial output. The 12-bit ADC enables users to measure pH with an accuracy of 0.003 of a pH unit. Adequate
power supply bypassing and grounding is extremely important for ADCs. Recommended bypass capacitors are
shown in Figure 52. It is common to share power supplies between different components in a circuit. To minimize
the effects of power supply ripples caused by other components, the op amps need to have bypass capacitors
on the supply pins. Using the same value capacitors as those used with the ADC are ideal. The combination of
these three values of capacitors ensures that AC noise present on the power supply line is grounded and does
not interfere with the amplifiers' signal.
20
Submit Documentation Feedback
Copyright © 2011–2013, Texas Instruments Incorporated
Product Folder Links: SM72501
�SM72501
www.ti.com
SNIS157C – JANUARY 2011 – REVISED APRIL 2013
+
V
pH ELECTRODE TEMPERATURE
0.01 PF
0.01 PF
0.1 PF
0.1 PF
10 PF
10 PF
+
75:
V
1 PF
+
1
A1
R2
10 k:
R1
10 k:
-
V+
+
V
VD
+
V
R3
10 k:
R4
10 k:
VA
+
CH0
-
VOUT
A2
CH1
+
RT
+
V
VOFFSET = 0.5012V
LM35
-V+
2
3
LM4140A
6
R5
10 k:
-
ADC12034
V
R6
3.3 k:
1,4,7,8
AGND
VREFVREF+
DGND
pH ELECTRODE
Figure 52. pH Measurement Circuit
Submit Documentation Feedback
Copyright © 2011–2013, Texas Instruments Incorporated
Product Folder Links: SM72501
21
�SM72501
SNIS157C – JANUARY 2011 – REVISED APRIL 2013
www.ti.com
REVISION HISTORY
Changes from Revision B (April 2013) to Revision C
•
22
Page
Changed layout of National Data Sheet to TI format .......................................................................................................... 21
Submit Documentation Feedback
Copyright © 2011–2013, Texas Instruments Incorporated
Product Folder Links: SM72501
�PACKAGE OPTION ADDENDUM
www.ti.com
10-Dec-2020
PACKAGING INFORMATION
Orderable Device
Status
(1)
Package Type Package Pins Package
Drawing
Qty
Eco Plan
(2)
Lead finish/
Ball material
MSL Peak Temp
Op Temp (°C)
Device Marking
(3)
(4/5)
(6)
SM72501MF/NOPB
NRND
SOT-23
DBV
5
1000
RoHS & Green
SN
Level-1-260C-UNLIM
-40 to 125
S501
SM72501MFE/NOPB
NRND
SOT-23
DBV
5
250
RoHS & Green
SN
Level-1-260C-UNLIM
-40 to 125
S501
SM72501MFX/NOPB
NRND
SOT-23
DBV
5
3000
RoHS & Green
SN
Level-1-260C-UNLIM
-40 to 125
S501
(1)
The marketing status values are defined as follows:
ACTIVE: Product device recommended for new designs.
LIFEBUY: TI has announced that the device will be discontinued, and a lifetime-buy period is in effect.
NRND: Not recommended for new designs. Device is in production to support existing customers, but TI does not recommend using this part in a new design.
PREVIEW: Device has been announced but is not in production. Samples may or may not be available.
OBSOLETE: TI has discontinued the production of the device.
(2)
RoHS: TI defines "RoHS" to mean semiconductor products that are compliant with the current EU RoHS requirements for all 10 RoHS substances, including the requirement that RoHS substance
do not exceed 0.1% by weight in homogeneous materials. Where designed to be soldered at high temperatures, "RoHS" products are suitable for use in specified lead-free processes. TI may
reference these types of products as "Pb-Free".
RoHS Exempt: TI defines "RoHS Exempt" to mean products that contain lead but are compliant with EU RoHS pursuant to a specific EU RoHS exemption.
Green: TI defines "Green" to mean the content of Chlorine (Cl) and Bromine (Br) based flame retardants meet JS709B low halogen requirements of


 工商网监
湘ICP备2023018690号
工商网监
湘ICP备2023018690号
