a
High Output Current
Differential Driver
AD815
FUNCTIONAL BLOCK DIAGRAM
FEATURES
Flexible Configuration
Differential Input and Output Driver
or Two Single-Ended Drivers
Industrial Temperature Range
High Output Power
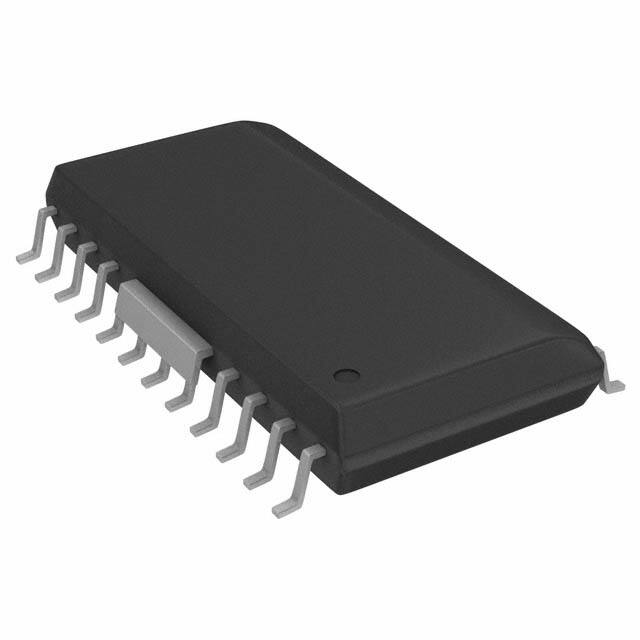
Thermally Enhanced SOIC
400 mA Minimum Output Drive/Amp, RL = 10 ⍀
Low Distortion
–66 dB @ 1 MHz THD, RL = 200 ⍀, V OUT = 40 V p-p
0.05% and 0.45ⴗ Differential Gain and Phase, R L = 25 ⍀
(6 Back-Terminated Video Loads)
High Speed
120 MHz Bandwidth (–3 dB)
900 V/s Differential Slew Rate
70 ns Settling Time to 0.1%
Thermal Shutdown
APPLICATIONS
ADSL, HDSL, and VDSL Line Interface Driver
Coil or Transformer Driver
CRT Convergence and Astigmatism Adjustment
Video Distribution Amp
Twisted Pair Cable Driver
GENERAL DESCRIPTION
The AD815 consists of two high speed amplifiers capable of
supplying a minimum of 500 mA. They are typically configured
as a differential driver enabling an output signal of 40 V p-p on
± 15 V supplies. This can be increased further with the use of a
coupling transformer with a greater than 1:1 turns ratio. The
low harmonic distortion of –66 dB @ 1 MHz into 200 Ω
NC 1
24 NC
NC 2
23 NC
NC 3
22 NC
NC 4
5
THERMAL
HEAT TABS
+VS*
21 NC
AD815
20
6
TOP VIEW 19
7 (Not to Scale) 18
8
THERMAL
HEAT TABS
+VS*
17
+IN1 9
16 +IN2
–IN1 10
15 –IN2
OUT1 11
14 OUT2
–VS 12
13 +VS
NC = NO CONNECT
*HEAT TABS ARE CONNECTED TO THE POSITIVE SUPPLY.
combined with the wide bandwidth and high current drive make
the differential driver ideal for communication applications such
as subscriber line interfaces for ADSL, HDSL and VDSL.
The AD815 differential slew rate of 900 V/µs and high load drive
are suitable for fast dynamic control of coils or transformers,
and the video performance of 0.05% and 0.45° differential gain
and phase into a load of 25 Ω enable up to 12 back-terminated
loads to be driven.
The 24-lead SOIC (RB) is capable of driving 26 dBm for full
rate ADSL with proper heat sinking.
+15V
1/2
AD815
100⍀
TOTAL HARMONIC DISTORTION – dBc
–40
–50
VS = ⴞ15V
G = +10
VOUT = 40V p-p
AMP1
499⍀
–60
VIN =
4Vp-p
110⍀
–70
–80
R1 = 15⍀
G = +10
RL
120⍀
VD =
40Vp-p
VOUT =
40Vp-p
499⍀
RL = 50⍀
(DIFFERENTIAL)
100⍀
1/2
AD815
RL = 200⍀
(DIFFERENTIAL)
–90
R2 = 15⍀
AMP2
1:2
TRANSFORMER
–15V
–100
Figure 2. Subscriber Line Differential Driver
–110
100
1k
10k
100k
FREQUENCY – Hz
1M
10M
Figure 1. Total Harmonic Distortion vs. Frequency
REV. D
Information furnished by Analog Devices is believed to be accurate and
reliable. However, no responsibility is assumed by Analog Devices for its
use, nor for any infringements of patents or other rights of third parties that
may result from its use. No license is granted by implication or otherwise
under any patent or patent rights of Analog Devices. Trademarks and
registered trademarks are the property of their respective owners.
One Technology Way, P.O. Box 9106, Norwood, MA 02062-9106, U.S.A.
Tel: 781/329-4700
www.analog.com
Fax: 781/461-3113
© 2015 Analog Devices, Inc. All rights reserved.
�AD815–SPECIFICATIONS (@ T = +25ⴗC, V = ⴞ15 V dc, R
A
Model
DYNAMIC PERFORMANCE
Small Signal Bandwidth (–3 dB)
Bandwidth (0.1 dB)
Differential Slew Rate
Settling Time to 0.1%
NOISE/HARMONIC PERFORMANCE
Total Harmonic Distortion
Input Voltage Noise
Input Current Noise (+I IN)
Input Current Noise (–I IN)
Differential Gain Error
Differential Phase Error
DC PERFORMANCE
Input Offset Voltage
S
FB
= 1 k⍀ and RLOAD = 100 ⍀ unless otherwise noted)
Conditions
VS
Min
G = +1
G = +1
G = +2
G = +2
VOUT = 20 V p-p, G = +2
10 V Step, G = +2
± 15
±5
± 15
±5
± 15
± 15
100
90
f = 1 MHz, RLOAD = 200 Ω, VOUT = 40 V p-p
f = 10 kHz, G = +2 (Single Ended)
f = 10 kHz, G = +2
f = 10 kHz, G = +2
NTSC, G = +2, RLOAD = 25 Ω
NTSC, G = +2, RLOAD = 25 Ω
AD815A
Typ Max
120
110
40
10
900
70
MHz
MHz
MHz
MHz
V/µs
ns
± 15
± 5, ± 15
± 5, ± 15
± 5, ± 15
± 15
± 15
–66
1.85
1.8
19
0.05
0.45
dBc
nV/√Hz
pA/√Hz
pA/√Hz
%
Degrees
±5
± 15
5
10
±5
± 15
20
0.5
0.5
± 5, ± 15
10
10
± 5, ± 15
2
± 5, ± 15
10
800
TMIN – TMAX
Input Offset Voltage Drift
Differential Offset Voltage
TMIN – TMAX
Differential Offset Voltage Drift
–Input Bias Current
TMIN – TMAX
+Input Bias Current
TMIN – TMAX
Differential Input Bias Current
TMIN – TMAX
± 5, ± 15
Open-Loop Transresistance
TMIN – TMAX
INPUT CHARACTERISTICS
Differential Input Resistance
Output Current1
RB-24
Short Circuit Current
Output Resistance
MATCHING CHARACTERISTICS
Crosstalk
POWER SUPPLY
Operating Range2
Quiescent Current
2
4
5
90
150
5
5
75
100
5.0
mV
mV
mV
µV/°C
mV
mV
mV
µV/°C
µA
µA
µA
µA
µA
µA
MΩ
MΩ
± 15
± 15
±5
± 5, ± 15
± 5, ± 15
57
80
± 15
±5
± 15
± 15
11.0
1.1
21
22.5
11.7
1.8
23
24.5
±V
±V
±V
±V
RLOAD = 10 Ω
± 15
± 15
± 15
400
500
1.0
13
mA
A
Ω
f = 1 MHz
± 15
–65
dB
±5
± 15
±5
± 15
± 5, ± 15
23
30
TMIN – TMAX
TMIN – TMAX
Single Ended, R LOAD = 25 Ω
Differential, R LOAD = 50 Ω
TMIN – TMAX
TMIN – TMAX
TMIN – TMAX
Power Supply Rejection Ratio
8
15
30
7
15
1.4
13.5
3.5
65
100
Differential Input Capacitance
Input Common-Mode Voltage Range
Common-Mode Rejection Ratio
Differential Common-Mode Rejection Ratio
OUTPUT CHARACTERISTICS
Voltage Swing
1.0
0.5
± 15
+Input
–Input
Units
TMIN – TMAX
–55
–66
± 18
30
40
40
55
MΩ
Ω
pF
±V
±V
dB
dB
V
mA
mA
mA
mA
dB
NOTES
1
Output current is limited in the 24-lead SOIC package to the maximum power dissipation. See absolute maximum ratings and derating curves.
2
Observe derating curves for maximum junction temperature.
Specifications subject to change without notice.
–2–
REV. D
�AD815
ABSOLUTE MAXIMUM RATINGS 1
MAXIMUM POWER DISSIPATION
Supply Voltage . . . . . . . . . . . . . . . . . . . . . . . . . . . ± 18 V Total
Internal Power Dissipation2
Small Outline (RB) . . 2.4 Watts (Observe Derating Curves)
Input Voltage (Common Mode) . . . . . . . . . . . . . . . . . . . . ± VS
Differential Input Voltage . . . . . . . . . . . . . . . . . . . . . . . . ± 6 V
Output Short Circuit Duration
. . . . . . . . . . . . . . . . . . . . . . Observe Power Derating Curves
Can Only Short to Ground
Storage Temperature Range
RB Package . . . . . . . . . . . . . . . . . . . . . . . –65°C to +125°C
Operating Temperature Range
AD815A . . . . . . . . . . . . . . . . . . . . . . . . . . . –40°C to +85°C
Lead Temperature Range (Soldering, 10 sec) . . . . . . . . 300°C
The maximum power that can be safely dissipated by the AD815
is limited by the associated rise in junction temperature. The
maximum safe junction temperature for the plastic encapsulated
parts is determined by the glass transition temperature of the
plastic, about 150°C. Exceeding this limit temporarily may
cause a shift in parametric performance due to a change in the
stresses exerted on the die by the package. Exceeding a junction
temperature of 175°C for an extended period can result in
device failure.
The AD815 has thermal shutdown protection, which guarantees
that the maximum junction temperature of the die remains below a
safe level, even when the output is shorted to ground. Shorting
the output to either power supply will result in device failure.
To ensure proper operation, it is important to observe the
derating curves and refer to the section on power considerations.
NOTES
1
Stresses above those listed under Absolute Maximum Ratings may cause permanent damage to the device. This is a stress rating only; functional operation of the
device at these or any other conditions above those indicated in the operational
section of this specification is not implied. Exposure to absolute maximum rating
conditions for extended periods may affect device reliability.
2
Specification is for device in free air with 0 ft/min air flow: 24-Lead Surface Mount:
θJA = 52°C/W.
It must also be noted that in high (noninverting) gain configurations
(with low values of gain resistor), a high level of input overdrive
can result in a large input error current, which may result in a
significant power dissipation in the input stage. This power
must be included when computing the junction temperature rise
due to total internal power.
PIN CONFIGURATION
24-Lead Thermally-Enhanced SOIC (RB-24)
NC 1
24 NC
NC 2
23 NC
NC 3
22 NC
NC 4
21 NC
5
THERMAL
HEAT TABS
+VS*
6
AD815
20
19
TOP VIEW
7 (Not to Scale) 18
8
MAXIMUM POWER DISSIPATION – Watts
14
THERMAL
HEAT TABS
+VS*
17
TJ = 150ⴗC
13
12
11
10
9
8
7
6
5
4
+IN1 9
16 +IN2
–IN1 10
15 –IN2
OUT1 11
14 OUT2
1
13 +VS
0
–50 –40 –30 –20 –10 0 10 20 30 40 50 60
AMBIENT TEMPERATURE – ⴗC
–VS 12
NC = NO CONNECT
*HEAT TABS ARE CONNECTED TO THE POSITIVE SUPPLY.
3
2
θJA = 52ⴗC/W
(STILL AIR = 0 FT/MIN)
NO HEAT SINK
70 80
90
Figure 3. Plot of Maximum Power Dissipation vs.
Temperature
CAUTION
ESD (electrostatic discharge) sensitive device. Electrostatic charges as high as 4000 V readily
accumulate on the human body and test equipment and can discharge without detection.
Although the AD815 features proprietary ESD protection circuitry, permanent damage may
occur on devices subjected to high energy electrostatic discharges. Therefore, proper ESD
precautions are recommended to avoid performance degradation or loss of functionality.
REV. D
AD815ARB-24
–3–
WARNING!
ESD SENSITIVE DEVICE
�AD815–Typical Performance Characteristics
36
34
10
5
0
5
10
15
SUPPLY VOLTAGE – ⴞVolts
VS = ⴞ5V
24
30
60
NO LOAD
20
RL = 50⍀
(DIFFERENTIAL)
RL = 25⍀
(SINGLE-ENDED)
40
20
10
0
5
10
15
SUPPLY VOLTAGE – ⴞVolts
40
30
15
VS = ⴞ5V
20
10
27
24
21
2
10
4
6
8
10
12
SUPPLY VOLTAGE – ⴞVolts
16
14
SIDE A, B
0
INPUT BIAS CURRENT – A
20
TA = +25ⴗC
Figure 8. Total Supply Current vs. Supply Voltage
DIFFERENTIAL OUTPUT VOLTAGE – Volts p-p
50
25
100
30
0
60
VS = ⴞ15V
80
18
0
20
Figure 5. Output Voltage Swing vs. Supply Voltage
30
0
20
40
60
JUNCTION TEMPERATURE – ⴗC
33
TOTAL SUPPLY CURRENT – mA
80
–20
Figure 7. Total Supply Current vs. Temperature
DIFFERENTIAL OUTPUT VOLTAGE – V p-p
SINGLE-ENDED OUTPUT VOLTAGE – V p-p
26
18
–40
20
40
0
SINGLE-ENDED OUTPUT VOLTAGE – Volts p-p
28
22
Figure 4. Input Common-Mode Voltage Range vs. Supply
Voltage
5
30
20
0
10
VS = ⴞ15V
32
15
SUPPLY CURRENT – mA
COMMON-MODE VOLTAGE RANGE – ⴞVolts
20
+I B
VS = ⴞ15V, ⴞ5V
–10
–20
VS = ⴞ5V
–30
SIDE B
–I B
–40
SIDE A
–50
SIDE B
–60
SIDE A
–70
–I B
VS = ⴞ15V
0
0
10
100
1k
10k
LOAD RESISTANCE – (Differential – ⍀) (Single-Ended – ⍀/2)
–80
–40
Figure 6. Output Voltage Swing vs. Load Resistance
–20
0
20
40
60
JUNCTION TEMPERATURE – ⴗC
80
100
Figure 9. Input Bias Current vs. Temperature
–4–
REV. D
�AD815
0
80
–2
60
–4
40
RTI OFFSET – mV
INPUT OFFSET VOLTAGE – mV
TA = 25ⴗC
VS = ⴞ5V
–6
–8
VS =
ⴞ15V
VS =
ⴞ10V
20
VS =
ⴞ5V
0
VIN
1/2
f = 0.1Hz 100⍀ AD815
VOUT
–20
–10
49.9⍀
VS = ⴞ15V
–12
–40
–14
–40
–60
–2.0 –1.6 –1.2
1k⍀
0
20
40
60
JUNCTION TEMPERATURE – ⴗC
–20
80
100
Figure 10. Input Offset Voltage vs. Temperature
RL=
5⍀
1k⍀
0
–0.8 –0.4
0.4
0.8
LOAD CURRENT – Amps
1.2
1.6
2.0
Figure 13. Thermal Nonlinearity vs. Output Current Drive
750
CLOSED-LOOP OUTPUT RESISTANCE – ⍀
SHORT CIRCUIT CURRENT – mA
VS = ⴞ15V
700
SOURCE
650
600
SINK
550
500
450
–60
–40
–20
0
20
40
60
80
100
JUNCTION TEMPERATURE – ⴗC
120
100
10
VS = ⴞ5V
VS = ⴞ15V
1
0.1
0.01
140
30k
Figure 11. Short Circuit Current vs. Temperature
100k
300k
1M
3M
10M
FREQUENCY – Hz
30M
100M
300M
Figure 14. Closed-Loop Output Resistance vs. Frequency
RTI OFFSET – mV
10
DIFFERENTIAL OUTPUT VOLTAGE – V p-p
15
VS = ⴞ10V
TA = 25ⴗC
RL = 25⍀
VS = ⴞ5V
VS = ⴞ15V
5
0
VIN
1/2
f = 0.1Hz 100⍀ AD815
VOUT
–5
49.9⍀
–10
1k⍀
1k⍀
–15
–20
RL=
25⍀
RL = 100⍀
30
RL = 50⍀
20
RL = 25⍀
10
RL = 1⍀
0
–16
–12
–8
–4
0
4
VOUT – Volts
8
12
16
0
20
Figure 12. Gain Nonlinearity vs. Output Voltage
REV. D
TA = 25ⴗC
VS = ±15V
40
2
4
10
8
6
FREQUENCY – MHz
12
14
Figure 15. Large Signal Frequency Response
–5–
�AD815
100
100
120
TRANSIMPEDANCE
10
NONINVERTING INPUT
CURRENT NOISE
INPUT VOLTAGE
NOISE
1
10
100
1k
FREQUENCY – Hz
100
500
80
0
–50
60
–100
50
–150
40
–200
30
–250
100
Figure 16. Input Current and Voltage Noise vs. Frequency
80
TOTAL HARMONIC DISTORTION – dBc
COMMON-MODE REJECTION – dB
10k
100k
1M
FREQUENCY – Hz
10M
100M
–40
VS = ⴞ15V
70
SIDE B
60
SIDE A
50
562⍀
562⍀
VOUT
VIN
30
562⍀
1/2
AD815
562⍀
20
10
10k
100k
1M
FREQUENCY – Hz
–50
–60
–70
–80
1k
10k
100k
FREQUENCY – Hz
1M
10M
Figure 20. Total Harmonic Distortion vs. Frequency
10
VS = ⴞ15V
G = +2
RL = 100⍀
–30
–40
–PSRR
–50
+PSRR
–60
–70
–80
–90
–100
0.01
RL = 200⍀
(DIFFERENTIAL)
–100
OUTPUT SWING FROM ±V TO 0 – Volts
–20
RL = 50⍀
(DIFFERENTIAL)
–90
0
–10
VS = ⴞ15V
G = +10
VOUT = 40V p-p
–110
100
100M
10M
Figure 17. Common-Mode Rejection vs. Frequency
PSRR – dB
1k
Figure 19. Open-Loop Transimpedance vs. Frequency
90
40
PHASE
70
1
100k
10k
100
90
PHASE – Degrees
10
TRANSIMPEDANCE – dB
INVERTING INPUT
CURRENT NOISE
CURRENT NOISE – pA/ √ Hz
VOLTAGE NOISE – nV/ √ Hz
110
8
1%
0.1%
6
GAIN = +2
VS = ⴞ15V
4
2
0
–2
–4
–6
1%
0.1%
–8
–10
0.1
1
10
FREQUENCY – MHz
100
300
0
Figure 18. Power Supply Rejection vs. Frequency
20
60
40
70
SETTLING TIME – ns
80
100
Figure 21. Output Swing and Error vs. Settling Time
–6–
REV. D
�AD815
700
1400
5
1200
500
1000
G = +2
400
800
300
600
200
400
100
200
0
OPEN-LOOP TRANSRESISTANCE – M⍀
600
DIFFERENTIAL SLEW RATE – V/s
SINGLE-ENDED SLEW RATE – V/s
(PER AMPLIFIER)
G = +10
0
0
5
10
15
OUTPUT STEP SIZE – V p-p
20
4
SIDE B
Figure 22. Slew Rate vs. Output Step Size
+TZ
SIDE A
2
–TZ
SIDE B
1
0
–40
25
SIDE A
3
–20
0
20
40
60
JUNCTION TEMPERATURE – ⴗC
100
Figure 25. Open-Loop Transresistance vs. Temperature
–85
15
VS = ⴞ15V
VS = ⴞ15V
SIDE B
–80
14
OUTPUT SWING – Volts
+PSRR
SIDE A
PSRR – dB
80
–75
–70
SIDE A
SIDE B
–65
RL = 150⍀
+VOUT
| –VOUT |
13
+VOUT
RL = 25⍀
12
| –VOUT |
11
–PSRR
–60
–40
–20
0
20
40
60
JUNCTION TEMPERATURE – ⴗC
80
10
–40
100
Figure 23. PSRR vs. Temperature
–20
0
20
40
60
JUNCTION TEMPERATURE – ⴗC
80
100
Figure 26. Single-Ended Output Swing vs. Temperature
27
–74
–73
26
OUTPUT SWING – Volts
CMRR – dB
–72
–71
–70
–69
–CMRR
VS = ⴞ15V
RL = 50⍀
25
–VOUT
+VOUT
24
–68
–66
–40
23
+CMRR
–67
–20
0
20
40
60
JUNCTION TEMPERATURE – ⴗC
80
22
–40
100
0
20
40
60
JUNCTION TEMPERATURE – ⴗC
80
100
Figure 27. Differential Output Swing vs. Temperature
Figure 24. CMRR vs. Temperature
REV. D
–20
7–
�AD815
2
3
4
5
6
7
8
9
2 BACK TERMINATED LOADS (75⍀)
0.010
0.005
0.000
–0.005
–0.010
–0.015
–0.020
–0.025
–0.030
PHASE
GAIN
GAIN
1
2
PHASE
3
4
5
6
7
8
9
0.12
0.10
0.08
G = +2
0.06
RF = 1k⍀ 0.04
NTSC
0.02
0.00
–0.02
–0.04
10 11
–3
–4
B
VIN
–0.3
–5
100⍀
–0.4
VOUT
–6
ⴞ5V
49.9⍀
–0.5
499⍀
499⍀
100⍀
–7
–8
–0.6
1
10
FREQUENCY – MHz
100
–9
300
Figure 31. Bandwidth vs. Frequency, G = +2
1
VS = ⴞ15V
G = +2
RF = 499⍀
VS = ⴞ15V, ⴞ5V
VIN = 400mVrms
RL = 100⍀
SIDE B
–50
–60
–70
SIDE A
–80
–90
–100
–110
0.03
A
A
–0.2
NORMALIZED OUTPUT VOLTAGE – dB
CROSSTALK – dB
–40
–2
B
–0.1
–10
–30
–1
0
–0.7
0.1
Figure 28. Differential Gain and Differential Phase
(per Amplifier)
–20
ⴞ15V
0.1
0
NORMALIZED FREQUENCY RESPONSE – dB
1
ⴞ5V
NORMALIZED FLATNESS – dB
GAIN
1
ⴞ15V
DIFF PHASE – Degrees
PHASE
0.5
0.4
0.3
G = +2
RF = 1k⍀ 0.2
0.1
NTSC
0.0
–0.1
–0.2
–0.3
10 11
DIFF PHASE – Degrees
DIFF GAIN – %
DIFF GAIN – %
6 BACK TERMINATED LOADS (25⍀)
0.04
0.03
0.02
0.01
0.00
–0.01
–0.02
–0.03
–0.04
0.1
1
10
FREQUENCY – MHz
100
0
SIDE A
SIDE B
–1
–2
–3
VIN
100⍀
49.9⍀
–5
124⍀
Figure 29. Output-to-Output Crosstalk vs. Frequency
499⍀
100⍀
–6
–7
0.1
300
VOUT
–4
1
10
FREQUENCY – MHz
100
300
Figure 32. –3 dB Bandwidth vs. Frequency, G = +5
2
1
VS = ⴞ15V
VIN = 0 dBm
SIDE B
OUTPUT VOLTAGE – dB
0
100
90
SIDE A
–1
–2
–3
VIN
100⍀
VOUT
–4
–5
49.9⍀
562⍀
10
100⍀
0%
–6
5V
–7
–9
0.1
1
10
FREQUENCY – MHz
100
1s
300
Figure 33. 40 V p-p Differential Sine Wave, RL = 50 Ω,
f = 100 kHz
Figure 30. –3 dB Bandwidth vs. Frequency, G = +1
–8–
REV. D
�AD815
RF
562⍀
10F
+15V
10F
+15V
0.1F
0.1F
RS
13
13
1/2 AD815
100⍀
VIN
12
PULSE
GENERATOR
50⍀
1/2 AD815
0.1F
–15V
50⍀
Figure 38. Test Circuit, Gain = 1 + R F /RS
G = +1
RF = 698⍀
RL = 100⍀
SIDE B
5V
20ns
100ns
Figure 39. 20 V Step Response, G = +5
Figure 35. 500 mV Step Response, G = +1
SIDE A
G = +5
RF = 562⍀
RL = 100⍀
RS = 140⍀
SIDE A
SIDE B
100mV
RL = 100⍀
10F
–15V
TR/TF = 250ps
Figure 34. Test Circuit, Gain = +1
SIDE A
0.1F
12
PULSE
GENERATOR
10F
TR/TF = 250ps
100⍀
VIN
RL = 100⍀
G = +1
RF = 562⍀
RL = 100⍀
562⍀
10F
+15V
SIDE B
0.1F
562⍀
13
VIN
PULSE
GENERATOR
55⍀
1/2 AD815
100⍀
12
TR/TF = 250ps
0.1F
RL = 100⍀
10F
–15V
1V
20ns
Figure 36. 4 V Step Response, G = +1
SIDE A
Figure 40. Test Circuit, Gain = –1
SIDE A
G = +1
RF = 562⍀
RL = 100⍀
SIDE B
SIDE B
2V
100mV
50ns
Figure 37. 10 V Step Response, G = +1
REV. D
G = –1
RF = 562⍀
RL = 100⍀
20ns
Figure 41. 500 mV Step Response, G = –1
–9–
�AD815
Choice of Feedback and Gain Resistors
SIDE A
The fine scale gain flatness will, to some extent, vary with
feedback resistance. It therefore is recommended that once
optimum resistor values have been determined, 1% tolerance
values should be used if it is desired to maintain flatness over
a wide range of production lots. Table I shows optimum values
for several useful configurations. These should be used as
starting point in any application.
G = –1
RF = 562⍀
RL = 100⍀
SIDE B
Table I. Resistor Values
1V
20ns
G=
Figure 42. 4 V Step Response, G = –1
THEORY OF OPERATION
The AD815 is a dual current feedback amplifier with high
(500 mA) output current capability. Being a current feedback
amplifier, the AD815’s open-loop behavior is expressed
as transimpedance, ∆V O /∆I –IN , or T Z . The open-loop
transimpedance behaves just as the open-loop voltage gain
of a voltage feedback amplifier, that is, it has a large dc value
and decreases at roughly 6 dB/octave in frequency.
562
499
499
499
1k
⬁
499
499
125
110
As to be expected for a wideband amplifier, PC board parasitics
can affect the overall closed-loop performance. Of concern are
stray capacitances at the output and the inverting input nodes. If
a ground plane is to be used on the same side of the board as
the signal traces, a space (5 mm min) should be left around the
signal lines to minimize coupling.
POWER SUPPLY BYPASSING
T Z (S )
VO
=G×
VIN
T Z (S ) + G × RIN + RF
Adequate power supply bypassing can be critical when optimizing
the performance of a high frequency circuit. Inductance in the
power supply leads can form resonant circuits that produce
peaking in the amplifier’s response. In addition, if large current
transients must be delivered to the load, then bypass capacitors
(typically greater than 1 µF) will be required to provide the best
settling time and lowest distortion. A parallel combination of
10.0 µF and 0.1 µF is recommended. Under some low frequency
applications, a bypass capacitance of greater than 10 µF may be
necessary. Due to the large load currents delivered by the
AD815, special consideration must be given to careful bypassing.
The ground returns on both supply bypass capacitors as well as
signal common must be “star” connected as shown in Figure 44.
where:
RF
RG
RIN = 1/gM ≈ 25 Ω
G = 1+
RF
RG
RIN
RG (⍀)
PRINTED CIRCUIT BOARD LAYOUT
CONSIDERATIONS
Since RIN is proportional to 1/gM, the equivalent voltage gain is
just TZ × gM, where the gM in question is the transconductance
of the input stage. Using this amplifier as a follower with gain,
Figure 43, basic analysis yields the following result:
RN
+1
–1
+2
+5
+10
RF (⍀)
VOUT
+VS
VIN
+IN
Figure 43. Current Feedback Amplifier Operation
RF
Recognizing that G × RIN