a
xDSL Line Driver
3 V to 12 V with Power-Down
AD8391
FEATURES
Ideal xDSL Line Driver for VoDSL or Low Power
Applications such as USB, PCMCIA, or PCI Based
Customer Premise Equipment (CPE)
High Output Voltage and Current Drive
340 mA Output Drive Current
Low Power Operation
3 V to 12 V Power Supply Range
1-Pin Logic Controlled Standby, Shutdown
Low Supply Current of 19 mA (Typical)
Low Distortion
–82 dBc SFDR, 12 V p-p into Differential 21 � @ 100 kHz
4.5 nV/√Hz Input Voltage Noise Density, 100 kHz
Out-of-Band SFDR = –72 dBc, 144 kHz to 500 kHz,
ZLINE = 100 �, PLINE = 13.5 dBm
High Speed
40 MHz Bandwidth (–3 dB)
375 V/�s Slew Rate
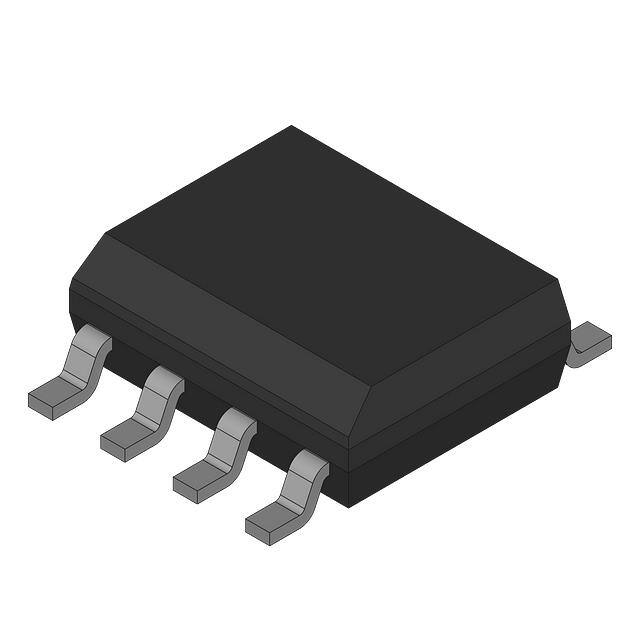
PIN CONFIGURATION
8-Lead SOIC
(Thermal Coastline)
�VS
IN1 1
PWDN 2
�
�
VMID
�VS
�
8
IN2
7
VMID
6
–VS
�
TE
+VS 3
VOUT1
4
5
VOUT2
LE
AD8391
B
SO
APPLICATIONS
VoDSL Modems
xDSL USB, PCI, PCMCIA Cards
Line Powered or Battery Backup xDSL Modems
The AD8391 consists of two parallel, low cost xDSL line drive
amplifiers capable of driving low distortion signals while running on
both 3 V to 12 V single-supply or equivalent dual-supply rails. It is
primarily intended for use in single-supply xDSL systems where low
power is essential, such as line powered and battery backup systems.
Each amplifier output drives more than 250 mA of current while
maintaining –82 dBc of SFDR at 100 kHz on 12 V, outstanding
performance for any xDSL CPE application.
O
The AD8391 provides a flexible power-down feature consisting of
a 1-pin digital control line. This allows biasing of the AD8391 to
full power (Logic 1), standby (Logic three-state maintains low
amplifier output impedance), and shutdown (Logic 0 places
amplifier outputs in a high impedance state). PWDN is referenced to –VS.
Fabricated on ADI’s high speed XFCB process, the high bandwidth
and fast slew rate of the AD8391 keep distortion to a minimum,
while dissipating a minimum of power. The quiescent current of the
AD8391 is low: 19 mA total static current draw. The AD8391
comes in a compact 8-lead SOIC “thermal coastline” package and
operates over the temperature range –40°C to +85°C.
UPSTREAM POWER – 10dB/DIV
PRODUCT DESCRIPTION
EMPTY BIN
25
137.5
250
FREQUENCY – kHz
Figure 1. Upstream Transit Spectrum with Empty Bin
at 45 kHz; Line Power = 12.5 dBm into 100 Ω
REV. A
Information furnished by Analog Devices is believed to be accurate and
reliable. However, no responsibility is assumed by Analog Devices for its
use, nor for any infringements of patents or other rights of third parties that
may result from its use. No license is granted by implication or otherwise
under any patent or patent rights of Analog Devices. Trademarks and
registered trademarks are the property of their respective owners.
One Technology Way, P.O. Box 9106, Norwood, MA 02062-9106, U.S.A.
Tel: 781/329-4700
www.analog.com
Fax: 781/326-8703
© 2003 Analog Devices, Inc. All rights reserved.
�AD8391–SPECIFICATIONS
Conditions
0.1 dB Bandwidth
Large Signal Bandwidth
Slew Rate
Rise and Fall Time
Settling Time
NOISE/HARMONIC
PERFORMANCE
Distortion, G = –5 (RG = 178 Ω)
Second Harmonic
Third Harmonic
MTPR (In-Band)
SFDR (Out-of-Band)
Input Noise Voltage
Input Noise Current
Crosstalk
DC PERFORMANCE
Input Offset Voltage
Input Offset Voltage Match
Transimpedance
O
OUTPUT CHARACTERISTICS
Output Resistance
Output Resistance
Output Voltage Swing
Linear Output Current
Short-Circuit Current
POWER SUPPLY
Supply Current
STBY Supply Current
SHUTDOWN Supply Current
Operating Range
Power Supply Rejection Ratio
LOGIC INPUT (PWDN)
Logic 1 Voltage
Logic 0 Voltage
Logic Input Bias Current
Turn-On Time
Max
Unit
G = –1, VOUT < 0.4 V p-p, RG = 909 Ω
G = –2, VOUT < 0.4 V p-p
VOUT < 0.4 V p-p
VOUT = 4 V p-p
VOUT = 4 V p-p
VOUT = 4 V p-p
0.1%, VOUT = 2 V p-p
40
38
4
50
375
8
60
MHz
MHz
MHz
MHz
V/µs
ns
ns
VOUT = 8 V p-p (Differential)
100 kHz, RL = 21 Ω
100 kHz, RL = 21 Ω
25 kHz to 138 kHz, RL = 21 Ω
144 kHz to 500 kHz, RL = 21 Ω
f = 100 kHz Differential
f = 100 kHz
f = 1 MHz, G = –2, Output to Output
–82
–95
–70
–72
4.5
9
64
dBc
dBc
dBc
dBc
nV/√Hz
pA/√Hz
dB
VMID = +VS/2
TMIN to TMAX
VMID = Float
TMIN to TMAX
∆VOUT = 5 V
In1, In2 pins
In1 – In2
VMID = VIN = 5.5 V to 6.5 V, ∆VOS /∆VIN, cm
B
SO
INPUT CHARACTERISTICS
Input Resistance
Input Bias Current
Input Bias Current Match
CMRR
Input CM Voltage Range
VMID Accuracy
VMID Input Resistance
VMID Input Capacitance
Typ
TE
DYNAMIC PERFORMANCE
–3 dB Bandwidth
Min
LE
Parameter
(@ 25�C, VS = 12 V, RL = 10 �, VMID = VS /2, G = –2, RF = 909 �, RG = 453 �,
unless otherwise noted. See TPC 1 for Basic Circuit Configuration.)
VMID = Float Delta from +VS/2
Frequency = 100 kHz, PWDN 1
Frequency = 100 kHz, PWDN 0
RLOAD = 100 Ω
SFDR < –75 dBc, f = 100 kHz, RL = 21 Ω
PWDN = 1
TMIN to TMAX
PWDN = Open or Three-State
PWDN = 0
Single Supply
VMID = VS /2, ∆VS = ± 0.5 V
±2
±3
±2
± 0.25
± 0.35
10
± 15
± 2.6
125
2.5
10
± 0.5
±6
48
1.2 to 10.8
±5
± 30
2.5
10
Ω
µA
µA
dB
V
mV
kΩ
pF
0.3
3
Ω
kΩ
V
mA
mA
0.1
11.9
340
1500
16
19
22
10
4
3.0
21
6
12
55
–VS + 2.0
RL = 21 Ω, IS = 90% of Typical
mV
mV
mV
mV
mV
MΩ
± 300
200
–VS + 0.8
mA
mA
mA
mA
V
dB
V
V
µA
ns
Specifications subject to change without notice.
–2–
REV. A
�AD8391
V = 3 V, R = 10 �, V = V /2, G = –2, R = 909 �, R = 453 �, unless otherwise noted.
SPECIFICATIONS (@See25�C,
TPC 1 for Basic Circuit Configuration.)
S
MID
S
Conditions
0.1 dB Bandwidth
Large Signal Bandwidth
Slew Rate
Rise and Fall Time
Settling Time
NOISE/HARMONIC
PERFORMANCE
Distortion
Second Harmonic
Third Harmonic
Input Noise Voltage
Input Noise Current
DC PERFORMANCE
Input Offset Voltage
Input Offset Voltage Match
Transimpedance
Min
O
OUTPUT CHARACTERISTICS
Output Resistance
Output Resistance
Output Voltage Swing
Linear Output Current
Short-Circuit Current
POWER SUPPLY
Supply Current
STBY Supply Current
SHUTDOWN Supply Current
Operating Range
Power Supply Rejection Ratio
LOGIC INPUTS (PWDN [1,0])
Logic 1 Voltage
Logic 0 Voltage
Logic Input Bias Current
Turn-On Time
Typ
G = –1, VOUT < 0.4 V p-p
G = –2, VOUT < 0.4 V p-p
VOUT < 0.4 V p-p
VOUT = 2 V p-p
VOUT = 2 V p-p
Differential, VOUT = 1 V p-p
0.1%, VOUT = 2 V p-p
37
36
3.5
30
50
15
110
VOUT = 4 V p-p (Differential)
100 kHz, RL = 21 Ω
100 kHz, RL = 21 Ω
f = 100 kHz Differential
f = 100 kHz
–81
–97
4.5
9
VMID = +VS/2
TMIN to TMAX
VMID = Float
TMIN to TMAX
∆VOUT = 1 V
In1, In2 pins
In1 – In2
VMID = VIN = 1.3 V to 1.5 V, ∆VOS /∆VIN, cm
B
SO
INPUT CHARACTERISTICS
Input Resistance
Input Bias Current
Input Bias Current Match
CMRR
Input CM Voltage Range
VMID Accuracy
VMID Input Resistance
VMID Input Capacitance
G
Max
VMID = Float, Delta from +V S /2
Frequency = 100 kHz, PWDN 1
Frequency = 100 kHz, PWDN 0
RL = 100 Ω
SFDR < –82 dBc, f = 100 kHz, RL = 21 Ω
PWDN = 1
TMIN to TMAX
PWDN = Open or Three-State
PWDN = 0
Single Supply
VMID = VS/2, ∆VS = ± 0.5 V
±3
±4
±3
± 0.1
± 0.2
8
± 15
± 2.6
Specifications subject to change without notice.
–3–
mV
mV
mV
mV
mV
MΩ
Ω
µA
µA
dB
V
mV
kΩ
pF
0.2
9
Ω
kΩ
V
mA
mA
2.9
125
1000
16
19
8
1
3.0
18
2
12
55
–VS + 2.0
RL = 21 Ω, IS = 90% of Typical
dBc
dBc
nV/√Hz
pA/√Hz
125
1
7
± 0.5
±4
48
1.2 to 2.1
±5
± 30
2.5
10
0.1
13
Unit
MHz
MHz
MHz
MHz
V/µs
ns
ns
TE
DYNAMIC PERFORMANCE
–3 dB Bandwidth
REV. A
F
LE
Parameter
L
± 60
200
–VS + 0.8
mA
mA
mA
mA
V
dB
V
V
µA
ns
�AD8391
ABSOLUTE MAXIMUM RATINGS 1
MAXIMUM POWER DISSIPATION
Supply Voltage . . . . . . . . . . . . . . . . . . . . . . . . . . . . . . . . 12.6 V
Internal Power Dissipation2
Small Outline Package (R) . . . . . . . . . . . . . . . . . . . 650 mW
Input Voltage (Common-Mode) . . . . . . . . . . . . . . . . . . . . ± VS
Logic Voltage, PWDN . . . . . . . . . . . . . . . . . . . . . . . . . . . . ± VS
Output Short-Circuit Duration
. . . . . . . . . . . . . . . . . . . . . Observe Power Derating Curve
Storage Temperature Range . . . . . . . . . . . . –65°C to +150°C
Operating Temperature Range . . . . . . . . . . . –40°C to +85°C
Lead Temperature Range (Soldering 10 sec) . . . . . . . . . 300°C
The maximum power that can be safely dissipated by the
AD8391 is limited by the associated rise in junction temperature.
The maximum safe junction temperature for a plastic encapsulated device is determined by the glass transition temperature of
the plastic, approximately 150°C. Temporarily exceeding this
limit may cause a shift in parametric performance due to a change
in the stresses exerted on the die by the package.
To ensure proper operation, it is necessary to observe the maximum power derating curve.
2.0
NOTES
1
Stresses above those listed under Absolute Maximum Ratings may cause permanent damage to the device. This is a stress rating only; functional operation of the
device at these or any other conditions above those indicated in the operational
section of this specification is not implied. Exposure to absolute maximum rating
conditions for extended periods may affect device reliability.
2
Specification is for device on a 4-layer board in free air at 85°C: 8-Lead SOIC
package: JA = 100°C/W.
1.5
TE
MAXIMUM POWER DISSIPATION – W
TJ = 150�C
8-LEAD SOIC PACKAGE
1.0
LE
0.5
0
–50 –40 –30 –20 –10 0 10 20 30 40 50 60 70
AMBIENT TEMPERATURE – �C
80 90
B
SO
Figure 2. Plot of Maximum Power Dissipation
vs. Temperature
ORDERING GUIDE
Model
AD8391AR
AD8391AR–REEL
AD8391AR–REEL7
AD8391AR–EVAL
Temperature
Range
Package
Description
Package
Option
–40°C to +85°C
–40°C to +85°C
–40°C to +85°C
8-Lead SOIC
8-Lead SOIC
8-Lead SOIC
Evaluation Board
R-8
R-8
R-8
O
CAUTION
ESD (electrostatic discharge) sensitive device. Electrostatic charges as high as 4000 V readily
accumulate on the human body and test equipment and can discharge without detection. Although
the AD8391 features proprietary ESD protection circuitry, permanent damage may occur on
devices subjected to high energy electrostatic discharges. Therefore, proper ESD precautions are
recommended to avoid performance degradation or loss of functionality.
–4–
REV. A
�Typical Performance Characteristics–AD8391
0.4
VS = �1.5V
G = –2
RL = 10�
CF
0.3
CF = 0pF
RF
VOUT
~
VIN
0.2
OUTPUT VOLTAGE – V
RG
RL
VMID
0.1�F
0.1�F
0.1�F
+
+
+VS
6.8�F
0.1
CF = 3pF
0
–0.1
–0.2
6.8�F
–0.3
–VS
–0.4
0
25
50
75
100
125
150
175
200
225
250
TE
TIME – ns
TPC 4. Small Signal Step Response
TPC 1. Single-Ended Test Circuit
2.0
0.4
VS = �6V
G = –2
RL = 10�
0.3
CF = 0pF
OUTPUT VOLTAGE – V
LE
OUTPUT VOLTAGE – V
0.1
CF = 3pF
–0.1
B
SO
–0.4
0
0.5
0
CF = 3pF
–0.5
–1.0
–0.2
–0.3
CF = 0pF
25
50
75
100
125
150
175
200
225
–1.5
–2.0
0
250
25
50
75
CF = 3pF
1
0
–1
175
200
225
250
VS = �6V
0.008
G = –2
0.006
OUTPUT ERROR – V
O
OUTPUT VOLTAGE – V
2
150
0.01
VS = �6V
G = –2
RL = 10�
CF = 0pF
125
TPC 5. Large Signal Step Response
TPC 2. Small Signal Step Response
3
100
TIME – ns
TIME – ns
4
VS = �1.5V
G = –2
RL = 10�
1.0
0.2
0
1.5
0.004
VIN = 1V p-p
0.002
0
–0.002
OUTPUT ERROR
–0.004
–2
–0.006
–3
–0.008
–0.01
–4
0
25
50
75
100
125
150
175
200
225
0
250
TPC 3. Large Signal Step Response
REV. A
50
100
150
200
TIME – ns
TIME – ns
TPC 6. 0.1% Settling Time
–5–
250
300
�AD8391
12
6
VS = �6V
RL = 10�
G = –2
9
OUTPUT VOLTAGE – dBV
0
3
0
–3
–6
–9
–9
–12
–15
–18
–15
–21
–18
0.1
1
10
100
–24
0.1
1000
FREQUENCY – MHz
1
10
1000
TE
TPC 10. Output Voltage vs. Frequency
1500
1200
VS = �6V
1250
VS = �1.5V
VOH @+85�C
VOH @–40�C
1000
750
500
VOL @+85�C
B
SO
VOL @+25�C
250
VOL @–40�C
0
0
100
200
300
400
1000
VOH @+85�C
500
600
700
800
VOH @ –40�C
800
600
400
200
VOL@+85�C
900 1000
TPC 8. Output Saturation Voltage vs. Load
15
12
0
50
100
150
0
12
3
–6
100
–9
0.1
1000
500
6
–6
10
450
STANDBY
–3
1
400
9
0
FULL POWER
350
VS = �1.5V
RL = 10�
G = �2
15
–3
–9
0.1
300
18
GAIN – dB
O
3
250
TPC 11. Output Saturation Voltage vs. Load
VS = �6V
RL = 10�
G = �2
6
200
LOAD CURRENT – mA
STANDBY
9
VOL@ +25�C
0
LOAD CURRENT – mA
18
VOL@ –40�C
VOH @+25�C
LE
VOH @+25�C
GAIN – dB
100
FREQUENCY – MHz
TPC 7. Output Voltage vs. Frequency
OUTPUT SATURATION VOLTAGE – m V
–3
–6
–12
OUTPUT SATURATION VOLTAGE – m V
OUTPUT VOLTAGE – dBV
6
VS = �1.5V
RL = 10�
G = –2
3
FULL POWER
1
10
100
1000
FREQUENCY – MHz
FREQUENCY – MHz
TPC 12. Small Signal Frequency Response
TPC 9. Small Signal Frequency Response
–6–
REV. A
�AD8391
140
60
120
CURRENT NOISE – pA/ Hz
VOLTAGE NOISE – nV/ Hz
50
VS = �6V
40
30
20
VS = �1.5V
10
0
VS = �1.5V
100
80
60
40
20
10
100
1k
10k
100k
VS = �6V
0
10
1M
100
1k
FREQUENCY – Hz
10k
VS = �6V
1k
VS = �1.5V
1k
OUTPUT IMPEDANCE – �
POWER-DOWN
100
10
B
SO
0.1
0.01
0.1
100
10
1
10
100
0.1
0.01
1000
0.1
1
O
POWER-UP
–40
–60
–80
VIN = 10dBm
VS = �6V
RL = 10�
G = –2
POWER-DOWN
–100
–120
0.1
1
10
FREQUENCY – MHz
100
–15
1000
VS = �6V
RL = 10�
POWER-DOWN
VIN = 10dBm
–20
SIGNAL FEEDTHROUGH – dB
–20
100
TPC 17. Output Impedance vs. Frequency
TPC 14. Output Impedance vs. Frequency
0
10
FREQUENCY – MHz
FREQUENCY – MHz
20
POWER-UP
1
POWER-UP
1
POWER-DOWN
LE
OUTPUT IMPEDANCE – �
1M
TPC 16. Current Noise vs. Frequency (RTI)
10k
CROSSTALK – dB
100k
TE
TPC 13. Voltage Noise vs. Frequency (RTI)
–25
–30
–35
G = –5, RG = 178�, RF = 909�
–40
–45
G = –2, RG = 453�, RF = 909�
–50
–55
0.1
1000
1
10
100
1000
FREQUENCY – MHz
TPC 18. Signal Feedthrough vs. Frequency
TPC 15. Crosstalk (Output to Output)
vs. Frequency
REV. A
10k
FREQUENCY – Hz
–7–
�AD8391
RG
–30
RF
RL = 21�
FOR VS = �6V, V OUT = 8V p-p
FOR VS = �1.5V, V OUT = 2V p-p
G = –5
–40
DIFFERENTIAL DISTORTION – dBc
VIN+
VOUT–
VMID
RL
CMID
VOUT+
RG
RF
–50
–60
HD2 @VS = �1.5V
–70
HD2 @ VS = �6V
–80
–90
HD3 @VS = �1.5V
–100
VIN–
HD3 @VS = �6V
–110
0.01
1
0.1
10
TE
FREQUENCY – MHz
TPC 19. Differential Output Test Setup
TPC 22. Differential Distortion vs. Frequency
–30
–30
VS = �6V
HD2 (FO = 500kHz)
–70
–80
–90
HD2 (FO = 100kHz)
–110
2
10
6
14
G = –5, (RG = 178�)
–50
18
–60
HD2 (FO = 500kHz)
–70
HD2 (FO = 100kHz)
–90
HD3 (FO = 100kHz)
–110
0
22
1
–25
–35
–65
5
6
–55
VS = �6V
RLINE = 100�
13.5dBm
–60
14dBm
13dBm
–65
–70
–75
–75
12.5dBm
–85
1.7
4
–50
SFDR – dBc
MTPR – dBc
13.5dBm 14dBm
13dBm
–55
3
TPC 23. Differential Distortion vs. Output Voltage
VS = �6V
RLINE = 100�
O
–45
2
OUTPUT VOLTAGE – V p-p
OUTPUT VOLTAGE – V p-p
TPC 20. Differential Distortion vs. Output Voltage
HD3 (FO = 500kHz)
–80
–100
HD3 (FO = 100kHz)
–100
RL = 21�
LE
–60
HD3 (FO = 500kHz)
DIFFERENTIAL DISTORTION – dBc
G = –5, (RG = 178�)
–50
VS = �1.5V
–40
RL = 21�
B
SO
DIFFERENTIAL DISTORTION – dBc
–40
1.8
12dBm
1.9
12.5dBm
2.0
2.1
2.2
–80
1.7
2.3
1.8
12dBm
1.9
2.0
2.1
2.2
2.3
TRANSFORMER TURNS RATIO
TRANSFORMER TURNS RATIO
TPC 21. MTPR vs. Transformer Turns Ratio
TPC 24. SFDR vs. Transformer Turns Ratio
–8–
REV. A
�AD8391
–30
–30
SINGLE-ENDED DISTORTION – dBc
–40
G = –5, (RG = 178�)
SINGLE-ENDED DISTORTION – dBc
VS = �6V
HD3 (FO = 500kHz)
–50
–60
HD2 (FO = 500kHz)
–70
–80
–90
HD2 (FO = 100kHz)
–100
VS = �1.5V
–40
G = –5, (RG = 178�)
HD2 (FO = 500kHz)
–50
HD3 (FO = 500kHz)
–60
–70
–80
HD2 (FO = 100kHz)
–90
–100
HD3 (FO = 100kHz)
–110
25
150
275
400
HD3 (FO = 100kHz)
525
–110
25
650
PEAK OUTPUT CURRENT – mA
TE
LE
B
SO
TIME – ns (100ns/DIV)
O
TPC 26. Overload Recovery
REV. A
225
275
VS = �1.5V
VIN = 500mV/DIV
VOUT = 500mV/DIV
G = –5
RL = 10�
VOUT
0V
VIN
0V
175
TPC 27. Single-Ended Distortion vs. Peak
Output Current
VS = �6V
VIN = 1V/DIV
VOUT = 2V/DIV
G = –5
RL = 10�
VOUT
125
PEAK OUTPUT CURRENT – mA
TPC 25. Single-Ended Distortion vs. Peak
Output Current
0V
75
–9–
VIN
0V
TIME – ns (100ns/DIV)
TPC 28. Overload Recovery
�AD8391
GENERAL INFORMATION
Theory of Operation
The AD8391 is a dual current feedback amplifier with high
output current capability. It is fabricated on Analog Devices’
proprietary eXtra Fast Complementary Bipolar Process (XFCB) that
enables the construction of PNP and NPN transistors with fT’s
greater than 3 GHz. The process uses dielectrically isolated
transistors to eliminate the parasitic and latch-up problems caused
by junction isolation. These features enable the construction of
high frequency, low distortion amplifiers.
VO
VP
The AD8391 has a unique pin out. The two noninverting inputs
of the amplifier are connected to the VMID pin, which is internally
biased by two 5 kΩ resistors forming a voltage divider between
+VS and –VS. VMID is accessible through Pin 7. There is also a
10 pF internal capacitor from VMID to –VS. The two inverting pins
are available at Pin 1 and Pin 8, allowing the gain of the amplifiers to
be set with external resistors. See Page 1 for a connection diagram
of the AD8391.
BIAS
VN
TE
Figure 3. Simplified Schematic
A simplified schematic of an amplifier is shown in Figure 3.
Emitter followers buffer the positive input, VP, to provide low
input current and current noise. The low impedance current
feedback summing junction is at the negative input, VN. The
output stage is another high gain amplifier used as an integrator
to provide frequency compensation. The complementary commonemitter output provides the extended output swing.
G=1
+
VO
VIN
IIN
LE
RIN
IT = IIN
CT
RT
+
–
A current feedback amplifier’s bandwidth and distortion performance are relatively insensitive to its closed-loop signal gain,
which is a distinct advantage over a voltage-feedback architecture.
Figure 4 shows a simplified model of a current feedback amplifier.
The feedback signal is an error current that flows into the inverting
node. RIN is inversely proportional to the transconductance of
the amplifier’s input stage, gmi. Circuit analysis of the pictured
follower with gain circuit yields:
VOUT
–
RF
B
SO
RG
Figure 4. Model of Current Feedback Amplifier
Feedback Resistor Selection
VOUT
G × Tz( s)
=
VIN
Tz( s) + RF + G × RIN
RF
RG
In current feedback amplifiers, selection of the feedback and
gain resistors will impact distortion, bandwidth, noise, and gain
flatness. Care should be exercised in the selection of these resistors
so that the optimum performance is achieved. Table I shows the
recommended resistor values for use in a variety of gain settings for
the test circuits in TPC 1 and TPC 19. These values are only
intended to be a starting point when designing for any application.
Tz( s) =
RF
1 + sCT ( RT )
Table I. Resistor Selection Guide
RIN =
1
≅ 125 Ω
gmi
where:
O
G =1+
Recognizing that G × RIN


 工商网监
湘ICP备2023018690号
工商网监
湘ICP备2023018690号
