HDSP-4830/4840/4850, HDSP-4832/4836 & HLCP-J100
10-Element Bar Graph Array
Data Sheet
Description
Features
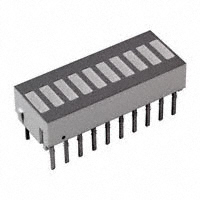
These 10-element LED arrays are designed to display
information in easily recognizable bar graph form. The
packages are end stackable and therefore capable of
displaying long strings of information. Use of these bar
graph arrays eliminates the alignment, intensity, and
color matching problems associated with discrete LEDs.
The HDSP-4830/4840/4850 and HLCPJ100 each contain
LEDs of one color. The HDSP-4832/4836 are multicolor
arrays with High Efficiency Red, Yellow, and High Performance Green LEDs in a single package.
• Custom Multicolor Array Capability
Applications
• Wide Viewing Angle
• Matched LEDs for Uniform Appearance
• End Stackable
• Package Interlock Ensures Correct Alignment
• Low Profile Package
• Rugged Construction
• Large, Easily Recognizable Segments
• High ON-OFF Contrast, Segment to Segment
• Categorized for Luminous Intensity
• Industrial Controls
• HDSP-4832/4836/4840/4850 Categorized for Dominant Wavelength
• Instrumentation
• Office Equipment
• HLCP-J100 Operates at Low Current
Typical Intensity of 1.0 mcd at 1 mA Drive Current
• Computer Peripherals
• Consumer Products
Package Dimensions
25.40 (1.000) MAX.
0.38
(0.015)
10.16
(0.400)
MAX.
5.08 (0.200)
2.54
(0.100)
DATE CODE
PIN ONE
MARKING
1.52
(0.060)
LUMINOUS
INTENSITY
CATEGORY
HDSP XXXX
XYY
0.61
(0.024)
1. DIMENSIONS IN MILLIMETERS (INCHES).
2. ALL UNTOLERANCED DIMEMSIONS FOR
REFERENCE ONLY.
3. HDSP-4832/-4836/-4840/-4850 ONLY.
6.10 ± 0.25
(0.240 ± 0.010)
COLOR BIN
(NOTE 3)
5.08 (0.200)
ZW
2.54 ± 0.25
(0.100 ± 0.010)
4.06
(0.160)
MIN.
0.38
(0.015)
7.62 ± 0.38
(0.300 ± 0.015)
�Absolute Maximum Ratings [1]
Parameter
Average PowerDissipation per LED
(TA = 25°C)
Peak Forward Current per LED
DC Forward Current per LED
AlGaAs Red
HLCP-J100
HER
HDSP-4830
Yellow
HDSP-4840
Green
HDSP-4850
37 mW
87 mW
50 mW
105 mW
45 mA[3]
90 mA[4]
60 mA[4]
90 mA[4]
15 mA[5]
-20°C to +100°C
-55°C to +100°C
5.0 V
Operating Temperature Range
Storage Temperature Range
Reverse Voltage per LED
Lead Solder Dipping Temperature
(1.59 mm (1/16 inch)
below seating plane) [7]
Wave Soldering Temperature
(at 2 mm distance from the body)
30 mA[6]
20 mA[6]
-40°C to +85°C
-40°C to +85°C
3.0 V
30 mA[6]
-20°C to +85°C
260°C for 5 seconds [8]
250°C for 3 seconds
Notes:
1. Absolute maximum ratings for HER, Yellow, and Green elements of the multicolor arrays are identical to the HDSP-4830/4840/4850 maximum
ratings.
2. See Figure 1 to establish pulsed operating conditions. Maximum pulse width is 1.5 ms.
3. See Figure 2 to establish pulsed operating conditions. Maximum pulse width is 1.5 ms.
4. See Figure 8 to establish pulsed operating conditions. Maximum pulse width is 2 ms.
5. Derate maximum DC current for Red above TA = 62°C at 0.79 mA/°C, and AlGaAs Red above TA = 91°C at 0.8 mA/°C. See Figure 3.
6. Derate maximum DC current for HER above TA = 48°C at 0.58 mA/ °C, Yellow above TA = 70°C at 0.66 mA/°C, and Green above TA = 37°C at 0.48
mA/°C. See Figure 9.
7. Clean only in water, isopropanol, ethanol, Freon TF or TE (or equivalent), or Genesolve DI-15 (or equivalent).
8. Maximum tolerable component side temperature is 134°C during solder process.
Internal Circuit Diagram
Segment
HDSP-4832
Segment Color
HDSP-4836
Segment Color
18
a
HER
HER
17
b
HER
HER
16
c
HER
Yellow
15
d
Yellow
Yellow
e
Yellow
Green
f
Yellow
Green
g
Yellow
Yellow
h
Green
Yellow
Green
HER
Green
HER
a
20
2
b
19
3
c
4
d
5
e
6
f
1
g
7
8
h
9
i
10
2
Multicolor Array Segment Colors
14
13
12
j
11
Pin
Function
Pin
Function
i
1
Anode a
11
Cathode j
j
2
Anode b
12
Cathode I
3
Anode c
13
Cathode h
4
Anode d
14
Cathode g
5
Anode e
15
Cathode f
6
Anode f
16
Cathode e
7
Anode g
17
Cathode d
8
Anode h
18
Cathode c
9
Anode i
19
Cathode b
10
Anode j
20
Cathode a
�Electrical/Optical Characteristics at TA = 25°C[4]
AlGaAs Red HLCP-J100
Parameter
Symbol
Min.
Typ.
Units
Test Conditions
Luminous Intensity per LED
(Unit Average) [1]
IV
600
1000
5200
mcd
IF = 1 mA
IF = 20 mA Pk;
1 of 4 Duty Factor
Peak Wavelength
Dominant Wavelength[2]
Forward Voltage per LED
λPEAK
λd
VF
645
637
1.6
nm
nm
V
IF = 1 mA
Reverse Voltage per LED[5]
VR
1.5
V
IR = 100 mA
Temperature Coefficient VF per LED
Thermal Resistance LED Junction-to-Pin
DVF/°C
RqJ-PIN
-2.0
300
mV/°C
°C/W/LED
1.8
5
Max.
2.2
IF = 20 mA
High Efficiency Red HDSP-4830
Parameter
Symbol
Min.
Typ.
Luminous Intensity per LED (Unit Average)[1,4]
Max.
Units
Test Conditions
IV
λPEAK
λd
VF
900
Peak Wavelength
Dominant Wavelength[2]
Forward Voltage per LED
3500
635
626
2.1
IF = 10 mA
2.5
mcd
nm
nm
V
Reverse Voltage per LED[5]
VR
3
IF = 20 mA
30
V
IR = 100 mA
Temperature Coefficient VF per LED
Thermal Resistance LED Junction-to-Pin
DVF /°C
RqJ-PIN
-2.0
300
mV/°C
°C/W/LED
Yellow HDSP-4840
Parameter
Symbol
Min.
Typ.
Luminous Intensity per LED (Unit Average)[1,4]
Peak Wavelength
Dominant Wavelength[2,3]
Forward Voltage per LED
IV
λPEAK
λd
VF
600
1900
583
585
2.2
Reverse Voltage per LED[5]
VR
3
Temperature Coefficient VF per LED
Thermal Resistance LED Junction-to-Pin
DVF/°C
RqJ-PIN
581
Max.
Units
Test Conditions
IF = 10 mA
592
2.5
mcd
nm
nm
V
IF = 20 mA
40
V
IR = 100 mA
-2.0
300
mV/°C
°C/W/LED
Green HDSP-4850
Parameter
Symbol
Min.
Typ.
Luminous Intensity per LED (Unit Average)[1,4]
Peak Wavelength
Dominant Wavelength[2,3]
Forward Voltage per LED
IV
λPEAK
λd
VF
600
1900
566
571
2.1
Max.
Units
Test Conditions
IF = 10 mA
577
2.5
mcd
nm
nm
V
Reverse Voltage per LED[5]
VR
3
IF = 20 mA
50
V
IR = 100 mA
Temperature Coefficient VF per LED
Thermal Resistance LED Junction-to-Pin
DVF/°C
RqJ-PIN
-2.0
300
mV/°C
°C/W/LED
Notes:
1. The bar graph arrays are categorized for luminous intensity. The category is designated by a letter located on the side of the package.
2. The dominant wavelength, λd, is derived from the CIE chromaticity diagram and is that single wavelength which defines the color of the device.
3. The HDSP-4832/-4836/-4840/-4850 bar graph arrays are categorized by dominant wavelength with the category designated by a number
adjacent to the intensity category letter. Only the yellow elements of the HDSP-4832/-4836 are categorized for color.
4. Electrical/optical characteristics of the High-Efficiency Red elements of the HDSP-4832/-4836 are identical to the HDSP-4830 characteristics.
Characteristics of Yellow elements of the HDSP-4832/-4836 are identical to the HDSP-4840. Characteristics of Green elements of the HDSP4832/-4836 are identical to the HDSP-4850.
5. Reverse voltage per LED should be limited to 3.0 V max. for the HDSP-4830/-4840/-4850/-4832/-4836 and 5.0 V max. for the HLCP-J100.
3
�Red, AlGaAs Red
1
10
100
1000
10000
DC OPERATION
I PEAK MAX RATIO OF MAXIMUM OPERATING
PEAK CURRENT TO TEMPERATURE
I DC MAX
DERATED MAXIMUM DC CURRENT
ATE
1
SH R
1.5
3
1
1
10
25
20
AlGaAs RED
10
5
0
25
35
45
55
65
75
85
95
0.9
0.8
0.7
0.6
0.5
0.4
105
0
20
60
80 100 120 140
IPEAK - PEAK SEGMENT CURRENT - mA
40
160
20
1.2
10
RELATIVE LUMINOUS INTENSITY
(NORMALIZED TO 1 AT 1mA)
1.4
1.0
0.8
0.6
0.4
140
RED
120
100
80
60
40
AlGaAs RED
20
0
0
0.5
1.0
1.5
2.0
5
10
15
20
25
5
2
1
IF - FORWARD CURRENT PER SEGMENT - mA
Figure 6. Relative Luminous Intensity vs. DC Forward Current – Red.
0.1
0.1
0.2
0.5
15
10
20
IF - FORWARD CURRENT PER SEGMENT
Figure 7. Relative Luminous Intensity vs. DC Forward Current – AlGaAs.
For a Detailed Explanation on the Use of Data Sheet Information and Recommended Soldering Procedures,
See Application Note 1005.
4
3.0
3.5
4.0
Figure 5. Forward Current vs. Forward Voltage.
0.2
0
2.5
VF - FORWARD VOLTAGE - V
Figure 4. Relative Efficiency (Luminous Intensity
per Unit Current) vs. Peak Current.
Figure 3. Maximum Allowable DC Current vs.
Ambient Temperature.
TJMAX = 100°C for Red and TJMAX = 110°C for
AlGaAs Red.
RELATIVE LUMINOUS INTENSITY
(NORMALIZED TO 1.0 AT 20 mA)
RED
1.0
TA - AMBIENT TEMPERATURE - oC
0
DC OPERATION
10000
160
AlGaAs RED
1.1
IF - FORWARD CURRENT PER SEGMENT - mA
ηPEAK - RELATIVE EFFICIENCY (NORMALIZED TO
1 AT 20 mA FOR RED: AT 1mA FOR AlGaAs RED)
IDC MAX - MAXIMUM DC CURRENT PER SEGMENT - mA
RED
15
1000
Figure 2. Maximum Tolerable Peak Current vs. Pulse Duration
– AlGaAs Red.
1.2
R θ J-A= 600¡C/W
30
100
tP - PULSE DURATION - µs
Figure 1. Maximum Tolerable Peak Current vs. Pulse Duration – Red.
35
OPERATION IN THIS
REGION REQUIRES
TEMPERATURE
DERATING OF IDC MAX
2
tP - PULSE DURATION - µSEC
40
EFRE
f-R
Hz
100
z
300 H
z
1 KH
2
4
z
3
5
10 K H
OPERATION IN THIS
REGION REQUIRES
TEMPERATURE
DERATING OF IDCMAX
10
9
8
7
6
3K H z
6
5
4
TE
H RA
FRES
f - RE
Hz
100
z
z
Hz
300
1 KH
H
10 K
8
z
3KH
15
12.5
10
IPEAK MAx RATIO OF MAXIMUM OPERATING
PEAK CURRENT TO TEMPERATURE
IDC MAX DERATED MAXIMUM DC CURRENT
20
�HER, Yellow, Green
20
8
GREEN
OPERATION IN
THIS REGION
REQUIRES
TEMPERATURE
DERATING OF
IDC MAX
HER
f-R
RATIO OF MAXIMUM OPERATING
IPEAK MAX
PEAK CURRENT TO TEMPERATURE
IDC MAX DERATED MAXIMUM DC CURRENT
15
12
10
R
ESH
EFR
6
YELLOW
ATE
4
3
z
z
H
100
H
300
Hz
1K
z
Hz
KH
3K
10
2
1.5
1
1
10
100
1000
10000
DC OPERATION
tP - PULSE DURATION - µSEC
Figure 8. Maximum Tolerable Peak Current vs. Pulse Duration –
HER/Yellow/Green.
1.6
R θ J-A= 600°C/W
35
1.4
GREEN/HER
30
GREEN
25
HER
YELLOW
20
YELLOW
15
10
HER SERIES
1.3
GREEN SERIES
1.2
1.1
1.0
0.9
0.8
5
0
YELLOW SERIES
1.5
ηPEAK - RELATIVE EFFICIENCY
IDC MAX - MAXIMUM DC CURRENT PER SEGMENT - mA
40
0.7
15
25
35
45
55
65
75
85
0.6
95
0
10
20
Figure 9. Maximum Allowable DC Current vs.
Ambient Temperature. TJMAX = 100°C.
90
60
80 90 100
70
3.5
60
RELATIVE LUMINOUS INTENSITY
IF - FORWARD CURRENT PER SEGMENT - mA
50
4.0
70
YELLOW SERIES
50
40
HER
SERIES
30
20
3.0
2.5
2.0
1.5
1.0
0.5
10
0
40
Figure 10. Relative Efficiency (Luminous Intensity
per Unit Current) vs. Peak Current.
GREEN SERIES
80
30
IPEAK - PEAK SEGMENT CURRENT - mA
TA - AMBIENT TEMPERATURE - °C
0
1.0
2.0
3.0
4.0
5.0
VF - FORWARD VOLTAGE - V
Figure 11. Forward Current vs. Forward Voltage.
0
53
10
15
20
25
30
5
40
IF - FORWARD CURRENT PER SEGMENT - mA
Figure 12. Relative Luminous Intensity vs. DC
Forward Current.
For a Detailed Explanation on the Use of Data Sheet Information and Recommended Soldering Procedures,
See Application Note 1005.
5
�Electrical/Optical
These versatile bar graph arrays are composed of ten
light emitting diodes. The light from each LED is optically stretched to form individual elements. The AlGaAs
Red (HLCP-J100) bar graph array LEDs use double heterojunction AlGaAs on a GaAs substrate. HER (HDSP4830) and Yellow (HDSP-4840) bar graph array LEDs
use a GaAsP epitaxial layer on a GaP substrate. Green
(HDSP-4850) bar graph array LEDs use liquid phase GaP
epitaxial layer on a GaP substrate. The multicolor bar
graph arrays (HDSP-4832/4836) have HER, Yellow, and
Green LEDs in one package. These displays are designed
for strobed operation. The typical forward voltage values
can be scaled from Figures 5 and 11. These values should
be used to calculate the current limiting resistor value
and typical power consumption. Expected maximum VF
values for driver circuit design and maximum power dissipation may be calculated using the VFMAX models:
Figures 4 and 10 allow the designer to calculate the luminous intensity at different peak and average currents.
The following equation calculates intensity at different
peak and average currents:
AlGaAs Red HLCP-J100 series
VFMAX = 1.8 V + IPeak (20 Ω)
For: IPeak ≤ 20 mA
VFMAX = 2.0 V + IPeak (10 Ω)
For: IPeak ≥ 20 mA
IV DATA SHEET is the data sheet luminous intensity,
resulting from IFAVG DATA SHEET.
HER (HDSP-4830) and Yellow
(HDSP-4840) series
VFMAX = 1.6 + IPeak (45 Ω)
For: 5 mA ≤ IPeak ≤ 20 mA
VFMAX = 1.75 + IPeak (38 Ω)
For: IPeak ≥ 20 mA
Green (HDSP-4850) series
VFMAX = 2.0 + IPeak (50 Ω)
For: IPeak > 5 mA
IVAVG = (IFAVG/IFAVG DATA
SHEET)ηpeak)(IVDATA SHEET)
Where:
IVAVG is the calculated time averaged luminous intensity resulting from IFAVG.
IFAVG is the desired time averaged LED current.
IFAVG DATA SHEET is the data sheet test current for
IVDATA SHEET.
ηpeak is the relative efficiency at the peak current,
scaled from Figure 4 or 10.
For example, what is the luminous intensity of an HDSP4830 driven at 50 mA peak 1/5 duty factor?
IFAVG = (50 mA) (0.2) = 10 mA
IFAVG DATA SHEET = 10 mA
ηpeak = 1.3
IV DATA SHEET = 3500 µcd
Therefore
IVAVG = (10 mA/10 mA) (1.3) (3500 mcd) = 4550 mcd
For product information and a complete list of distributors, please go to our web site: www.avagotech.com
Avago, Avago Technologies, and the A logo are trademarks of Avago Technologies in the United States and other countries.
Data subject to change. Copyright © 2005-2015 Avago Technologies. All rights reserved. Obsoletes AV01-0277EN
AV02-1798EN - April 16, 2015
�
很抱歉,暂时无法提供与“HDSP-4836”相匹配的价格&库存,您可以联系我们找货
免费人工找货- 国内价格 香港价格
- 1+70.762761+9.08510
- 10+53.8091910+6.90847
- 120+43.27828120+5.55642
- 600+39.12664600+5.02340
- 1080+37.969811080+4.87488
- 2040+36.890322040+4.73628