THS6062
www.ti.com
SLOS228D – JANUARY 1999 – REVISED OCTOBER 2007
LOW-NOISE ADSL DUAL DIFFERENTIAL RECEIVER
FEATURES
1
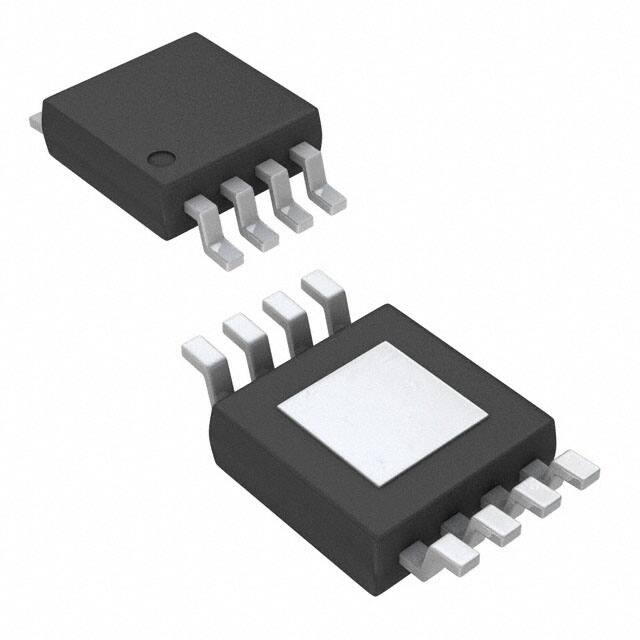
SOIC (D) AND MSOP PowerPAD?
(TOP VIEW)
• ADSL Differential Receiver
• Low 1.6 nV/√Hz Voltage Noise
• High Speed
– 100 MHz Bandwidth [–3 dB, G = 2 (–1)]
– 100 V/μs Slew Rate
• 90 mA Output Drive (Typ)
• Very Low Distortion
– THD = –72 dBc (f = 1 MHz, RL = 150 Ω)
– THD = –90 dBc (f = 1 MHz, RL = 1 kΩ)
• 5 V, ±5 V to ±15 V Typical Operation
• Available in Standard SOIC or MSOP
PowerPAD™ Package
2
1OUT
1IN −
1IN +
−VCC
1
8
2
7
3
6
4
5
(DGN) PACKAGE
VCC+
2OUT
2IN−
2IN+
DESCRIPTION
The THS6062 is a high-speed differential receiver designed for ADSL data communication systems. Its very low
1.6 nV/√Hz voltage noise provides the high signal-to-noise ratios necessary for the long transmission lengths of
ADSL systems over copper telephone lines. In addition, this receiver operates with a very low distortion of –90
dBc (f = 1 MHz, RL = 1 kΩ), exceeding the distortion requirements of ADSL CODECs. The THS6062 is a voltage
feedback amplifier offering a high 100-MHz bandwidth and 100-V/μs slew rate and is stable at gains of 2(–1) or
greater. It operates over a wide range of power supply voltages including 5 V and ±5 V to ±15 V. This device is
available in standard SOIC or MSOP PowerPAD package. The small, surface-mount, thermally-enhanced MSOP
PowerPAD package is fully compatible with automated surface-mount assembly procedures.
THS6022
Driver 1
VI+
50 Ω
+
_
1:1
To Telephone Line
1 kΩ
2 kΩ
THS6062
1 kΩ
Driver 2
VI−
100 Ω
1 kΩ
50 Ω
+
_
1 kΩ
−
+
1 kΩ
Receiver 1
VO+
2 kΩ
1 kΩ
1 kΩ
1 kΩ
−
+
VO−
Receiver 2
Figure 1. Typical Client-Side ADSL Application
1
2
Please be aware that an important notice concerning availability, standard warranty, and use in critical applications of
Texas Instruments semiconductor products and disclaimers thereto appears at the end of this data sheet.
PowerPAD is a trademark of Texas Instruments.
PRODUCT PREVIEW information concerns products in the
formative or design phase of development. Characteristic data and
other specifications are design goals. Texas Instruments reserves
the right to change or discontinue these products without notice.
Copyright © 1999–2007, Texas Instruments Incorporated
PRODUCT PREVIEW
Cross Section View of DGN Package
�THS6062
www.ti.com
SLOS228D – JANUARY 1999 – REVISED OCTOBER 2007
These devices have limited built-in ESD protection. The leads should be shorted together or the device placed in conductive foam
during storage or handling to prevent electrostatic damage to the MOS gates.
HIGH-SPEED XDSL LINE DRIVER/RECEIVER FAMILY
DEVICE
DRIVER
RECEIVER
THS6002
•
•
THS6012
•
THS6022
•
THS6062
•
THS7002
•
5V
±5 V
±15 V
BW (MHz)
SR
(V/μs)
THD
f = 1 MHz
(dB)
IO
(mA)
Vn
(nV/√Hz)
•
•
140
1000
–62
500
1.7
•
•
140
1300
–65
500
1.7
•
•
210
1900
–66
250
1.7
•
•
100
100
–72
90
1.6
•
•
70
100
–84
25
2.0
•
AVAILABLE OPTIONS
PACKAGED DEVICES
PRODUCT PREVIEW
(1)
TA
PLASTIC
SMALL OUTLINE (1) (D)
PowerPAD PLASTIC
MSOP (1) (DGN)
MSOP SYMBOL
EVALUATION
MODULE
0°C to 70°C
THS6062CD
THS6062CDGN
TIABE
THS6062EVM
–40°C to 85°C
THS6062ID
THS6062IDGN
TIABH
—
The D and DGN packages are available taped and reeled. Add an R suffix to the device type (i.e., THS6062CDGNR).
FUNCTIONAL BLOCK DIAGRAM
VCC+
8
1IN−
2
−
1
1IN+
2IN−
3
6
−
7
2IN+
5
1OUT
+
2OUT
+
4
VCC−
2
Submit Documentation Feedback
Copyright © 1999–2007, Texas Instruments Incorporated
Product Folder Link(s): THS6062
�THS6062
www.ti.com
SLOS228D – JANUARY 1999 – REVISED OCTOBER 2007
ABSOLUTE MAXIMUM RATINGS
over operating free-air temperature range (unless otherwise noted)
(1)
VALUE
UNIT
33
V
VCC+ to VCC–
Supply voltage
VI
Input voltage
IO
Output current
150
mA
VIO
Differential input voltage
±4
V
±VCC
Continuous total power dissipation
TA
Operating free-air temperature
TJ
Maximum junction temperature
Tstg
Storage temperature
See Dissipation Rating Table
C-suffix
0C to 70
°C
I-suffix
–40 to 85
°C
150
°C
–65 to 150
°C
300
°C
Lead temperature 1,6 mm (1/16 inch) from case for 10 seconds
(1)
Stresses beyond those listed under absolute maximum ratings may cause permanent damage to the device. These are stress ratings
only and functional operation of the device at these or any other conditions beyond those indicated under recommended operating
conditions is not implied. Exposure to absolute-maximum-rated conditions for extended periods may affect device reliability.
PACKAGE
θJA
(°C/W)
θJC
(°C/W)
TA = 25°C
POWER RATING
D
167 (1)
38.3
740 mW
58.4
4.7
2.14 W
DGN
(1)
(2)
(2)
PRODUCT PREVIEW
DISSIPATION RATINGS
This data was taken using the JEDEC standard Low-K test PCB. For the JEDEC Proposed High-K test
PCB, the θJA is 95°C/W with a power rating at TA = 25°C of 1.32 W.
This data was taken using 2 oz. trace and copper pad that is soldered directly to a 3 in. × 3 in. PC. For
further information, refer to Application Information section of this data sheet.
RECOMMENDED OPERATING CONDITIONS
MIN
VCC+ and
VCC–
Supply voltage
TA
Operating free-air temperature
Dual supply
Single supply
C-suffix
I-suffix
NOM
MAX
±2.5
±16
5
32
0
70
–40
85
Submit Documentation Feedback
Copyright © 1999–2007, Texas Instruments Incorporated
Product Folder Link(s): THS6062
UNIT
V
°C
3
�THS6062
www.ti.com
SLOS228D – JANUARY 1999 – REVISED OCTOBER 2007
ELECTRICAL CHARACTERISTICS
At TA = 25°C, VCC = ±15 V, RL = 150 Ω (unless otherwise noted)
TEST CONDITIONS (1)
PARAMETER
VCC
Supply voltage operating range
Single supply
VCC = ±15 V
ICC
Supply current (per amplifier)
MIN
Dual supply
VCC = ±5 V
VCC = ±2.5 V
VO
Output voltage swing
VCC = ±5 V
VCC = ±2.5 V
PRODUCT PREVIEW
IO
Output current
VCC = ±5 V
Short-circuit current (2)
VCC = ±15 V
VIO
Input offset voltage
VCC = ±5 V or VCC = ±15 V
Offset drift
VCC = ±5 V or VCC = ±15 V
IIB
Input bias current
VCC = ±5 V or VCC = ±15 V
IOS
Input offset current
VCC = ±5 V or VCC = ±15 V
Offset current drift
VCC = ±5 V or VCC = ±15 V
VCC = ±15 V, VICR = ±12 V
CMRR
Common mode rejection ratio
VCC = ±5 V, VICR = ±2.5 V
PSRR
Power supply rejection ratio
VICR
Common-mode input voltage range
RI
Input resistance
CI
Input capacitance
RO
Output resistance
Open loop gain
(1)
(2)
4
VCC = ±5 V or ±15 V
7.5
RL = 150 Ω
RL = 20 Ω
9
10.5
7.3
TA = full range
RL = 250 Ω
10
11
TA = 25°C
VCC = ±2.5 V
ISC
8.5
TA = full range
VCC = ±15 V
(2)
33
TA = 25°C
VCC = ±2.5 V
VCC = ±15 V
4.5
TA = full range
RL = 1 Ω
MAX
±16.5
TA = 25°C
VCC = ±15 V
VCC = ±5 V
TYP
±2.25
9
10.5
±13
±13.6
±3.4
±3.8
±1
±1.3
±12
±12.9
±3
±3.5
±0.9
±1.2
60
90
50
70
40
55
1.5
TA = full range
3
TA = full range
6
30
TA = full range
250
400
TA = full range
0.3
TA = 25°C
85
TA = full range
80
TA = 25°C
90
TA = full range
85
TA = 25°C
85
TA = full range
80
100
95
±13.5
±14.3
VCC = ±5 V
±3.8
±4.3
VCC = ±2.5 V
±1.4
±1.8
VCC = ±5 V, VO = ±10 V,
RL = 1 kΩ
TA = 25°C
40
TA = full range
35
VCC = ±5 V, VO = ±2.5 V,
RL = 1 kΩ
TA = 25°C
35
TA = full range
30
mV
μA
nA
nA/°C
95
VCC = ±15 V
Open loop
mA
μV/°C
6
8
TA = 25°C
mA
mA
20
TA = 25°C
mA
mA
8
TA = full range
V
V
150
TA = 25°C
UNIT
dB
dB
V
2
MΩ
1.5
pF
13
Ω
70
50
V/mV
V/mV
Full range = 0°C to 70°C for the THS6062C and –40°C to 85°C for the THS6062I.
Observe power dissipation ratings to keep the junction temperature below absolute maximum ratings when the output is heavily loaded
or shorted. See the absolute maximum ratings section for more information.
Submit Documentation Feedback
Copyright © 1999–2007, Texas Instruments Incorporated
Product Folder Link(s): THS6062
�THS6062
www.ti.com
SLOS228D – JANUARY 1999 – REVISED OCTOBER 2007
OPERATING CHARACTERISTICS
At TA = 25°C, VCC = ±15 V, RL = 150 Ω (unless otherwise noted)
TEST CONDITIONS (1)
VCC = ±15 V
SR
Slew rate
(2)
ts
Settling time to 0.01%
VCC = ±5 V
GAIN = –1
5-V step
VCC = ±5 V,
2.5-V step
VCC = ±2.5 V,
1-V step
VCC = ±15 V,
5-V step
VCC = ±5 V,
2.5-V step
VCC = ±2.5 V,
1-V step
THD
Total harmonic distortion
Vn
Input voltage noise
VCC = ±5 V or ±15 V, f = 10 kHz
In
Input current noise
Channel-to-channel crosstalk
(1)
(2)
(3)
80
V/μs
60
GAIN = –1
45
ns
35
90
GAIN = –1
80
RL = 150 Ω
–72
RL = 1 kΩ
–90
ns
75
dBc
nV/√Hz
VCC = ±5 V or ±15 V, f = 10 kHz
1.2
pV/√Hz
VCC = ±15 V
100
VO(pp) = 0.4 V,
Gain = 2, –1
VCC = ±5 V
90
50
VO(pp) = 0.4 V,
Gain = 2, –1
45
VCC = ±2.5 V
40
VO(pp) = 20 V, VCC = ±15 V
1.6
VO(pp) = 5 V, VCC = ±5 V
MHz
85
VCC = ±15 V
Full power bandwidth (3)
UNIT
1.6
Dynamic performance small-signal
VCC = ±5 V
bandwidth (–3 dB)
VCC = ±2.5 V
Bandwidth for 0.1 dB flatness
MAX
70
VCC = ±15 V,
VCC = ±5 V or ±15 V,
VO(pp) = 2 V, f = 1 MHz, Gain = 2)
BW
TYP
100
VCC = ±2.5 V
Settling time to 0.1%
MIN
PRODUCT PREVIEW
PARAMETER
RL = 1 kΩ
VCC = ±5 V or ±15 V, f = 1 MHz, Gain = 2
5
–61
MHz
MHz
dBc
Full range = 0°C to 70°C for the THS6062C and –40°C to 85°C for the THS6062I.
Slew rate is measured from an output level range of 25% to 75%.
Full power bandwidth = slew rate /2 π V(peak)
Submit Documentation Feedback
Copyright © 1999–2007, Texas Instruments Incorporated
Product Folder Link(s): THS6062
5
�THS6062
www.ti.com
SLOS228D – JANUARY 1999 – REVISED OCTOBER 2007
PARAMETER MEASUREMENT INFORMATION
330 Ω
330 Ω
330 Ω
_
VI1
330 Ω
_
VO2
VO1
+
CH1
150 Ω
+
150 Ω
50 Ω
VI2
CH2
50 Ω
Figure 2. THS6062 Crosstalk Test Circuit
Rg
Rf
_
VI
VO
+
RL
50 Ω
PRODUCT PREVIEW
Figure 3. Step Response Test Circuit
Rg
Rf
VI
_
50 Ω
VO
+
RL
Figure 4. Step Response Test Circuit
6
Submit Documentation Feedback
Copyright © 1999–2007, Texas Instruments Incorporated
Product Folder Link(s): THS6062
�THS6062
www.ti.com
SLOS228D – JANUARY 1999 – REVISED OCTOBER 2007
TYPICAL CHARACTERISTICS
Table of Graphs
FIGURE
VIO
Input offset voltage
vs Free-air temperature
5
IIB
Input bias current
vs Free-air temperature
6
VO
Output voltage
vs Supply voltage
7
Maximum output voltage swing
vs Free-air temperature
8
IO
Maximum output current
vs Free-air temperature
9
ICC
Supply current
vs Free-air temperature
10
VIC
Common-mode input voltage
vs Supply voltage
11
ZO
Closed-loop output impedance
vs Frequency
12
13
Power-supply rejection ratio
vs Frequency
14
CMRR
Common-mode rejection ratio
vs Frequency
15
Voltage noise and current noise
vs Frequency
16
Crosstalk
vs Frequency
17
Harmonic distortion
vs Frequency
18, 19
Harmonic distortion
vs Peak-to-peak output voltage
20, 21
Slew rate
vs Free-air temperature
0.1% settling time
vs Output voltage step size
Output amplitude
vs Frequency
SR
PRODUCT PREVIEW
Open-loop gain and Phase Response
PSRR
22
23
24–30
Small and large frequency response
31–34
1-V step response
35, 36
4-V step response
37
20-V step response
38
INPUT OFFSET VOLTAGE
vs
FREE-AIR TEMPERATURE
INPUT BIAS CURRENT
vs
FREE-AIR TEMPERATURE
3.10
−1.2
VCC = ± 15 V
I IB − Input Bias Current − mA
V IO − Input Offset Voltage − mV
3.05
−1.3
VCC = ± 5 V
−1.4
−1.5
VCC = ± 15 V
−1.6
−1.7
3
2.95
2.90
2.85
VCC = ± 5 V
2.80
2.75
−1.8
−40
−20
60
40
80
0
20
TA − Free-Air Temperature − °C
100
2.70
−40
Figure 5.
−20
0
20
40
60
80
TA − Free-Air Temperature − °C
100
Figure 6.
Submit Documentation Feedback
Copyright © 1999–2007, Texas Instruments Incorporated
Product Folder Link(s): THS6062
7
�THS6062
www.ti.com
SLOS228D – JANUARY 1999 – REVISED OCTOBER 2007
OUTPUT VOLTAGE
vs
SUPPLY VOLTAGE
MAXIMUM OUTPUT VOLTAGE SWING
vs
FREE-AIR TEMPERATURE
14
14
Maximum Output Voltage Swing − ± V
TA = 25°C
|VO | − Output Voltage Swing − V
12
10
RL = 1 kΩ
8
RL = 150 Ω
6
4
2
13.5
PRODUCT PREVIEW
2
4
6
8
10
12
± VCC − Supply Voltage − ± V
14
12
4.5
3.5
2.5
2
−20
60
80
0
20
40
TA − Free-Air Temperature − °C
MAXIMUM OUTPUT CURRENT
vs
FREE-AIR TEMPERATURE
SUPPLY CURRENT
vs
FREE-AIR TEMPERATURE
100
11
VCC = ± 15 V
Sink Current
100
10
I CC − Supply Current − mA
I O − Maximum Output Current − mA
VCC = ± 2.5 V
RL = 150 Ω
VCC = ± 2.5 V
RL = 1 kΩ
Figure 8.
RL = 20 Ω
90
VCC = ± 5 V
Sink Current
VCC = ± 15 V
Source Current
VCC = ± 5 V
Source Current
70
60
50
−40
9
VCC = ± 15 V
8
−20
VCC = ± 2.5 V
7
VCC = ± 5 V
6
VCC = ± 2.5 V
Sink Current
VCC = ± 10 V
VCC = ± 2.5 V
Source Current
60
80
0
20
40
TA − Free-Air Temperature − °C
100
5
−40
Figure 9.
8
VCC = ± 5 V
RL = 150 Ω
3
Figure 7.
110
80
VCC = ± 5 V
RL = 1 kΩ
4
1
−40
16
VCC = ± 15 V
RL = 250 Ω
12.5
1.5
0
VCC = ± 15 V
RL = 1 kΩ
13
−20
60
80
0
20
40
TA − Free-Air Temperature − °C
100
Figure 10.
Submit Documentation Feedback
Copyright © 1999–2007, Texas Instruments Incorporated
Product Folder Link(s): THS6062
�THS6062
www.ti.com
SLOS228D – JANUARY 1999 – REVISED OCTOBER 2007
COMMON-MODE INPUT VOLTAGE
vs
SUPPLY VOLTAGE
CLOSED-LOOP OUTPUT IMPEDANCE
vs
FREQUENCY
100
12.5
10
7.5
5
2.5
0
0
2.5
Gain = 1
RF = 1 kΩ
PI = + 3 dBm
10
12.5
5
7.5
± VCC − Supply Voltage − ± V
10
1
1 kΩ
−
0.1
+
50 Ω
VI
THS6062
1000
VO
Zo =
−1
VI
(
0.01
100 k
15
VO
1 kΩ
10 M
1M
100 M
)
500 M
PRODUCT PREVIEW
TA = 25°C
Z O − Closed-Loop Output Impedance − Ω
VIC − Common-Mode Input Voltage − ± V
15
f − Frequency − Hz
Figure 11.
Figure 12.
OPEN-LOOP GAIN AND PHASE RESPONSE
100
45°
VCC = ± 15 V
RL = 150 Ω
80
0°
60
−45°
Phase
40
−90°
20
−135°
0
−180°
−20
100
Phase Response
Open-Loop Gain − dB
Gain
−225°
1k
10 k
100 k
1M
10 M 100 M 1 G
f − Frequency − Hz
Figure 13.
Submit Documentation Feedback
Copyright © 1999–2007, Texas Instruments Incorporated
Product Folder Link(s): THS6062
9
�THS6062
www.ti.com
SLOS228D – JANUARY 1999 – REVISED OCTOBER 2007
POWER-SUPPLY REJECTION RATIO
vs
FREQUENCY
COMMON-MODE REJECTION RATIO
vs
FREQUENCY
120
CMRR − Common-Mode Rejection Ratio − dB
PSRR − Power-Supply Rejection Ratio − dB
120
100
VCC+
80
60
VCC−
40
20
VCC = ± 15 V and ± 5 V
100
1k
10 k
100 k
1M
10 M
60
_
VI
+
20
1 kΩ
1 kΩ
VO
RL
150 Ω
10
100
1k
10 k
100 k
1M
f − Frequency − Hz
f − Frequency − Hz
Figure 14.
Figure 15.
VOLTAGE NOISE AND CURRENT NOISE
vs
FREQUENCY
CROSSTALK
vs
FREQUENCY
10 M 100 M
0
VCC = ± 15 V AND ± 5 V
TA = 25°C
−10
VCC = ± 15 V
PI = 0 dBm
See Figure 1
−20
Crosstalk − dB
10
−30
−40
−50
Input = CH 2
Output = CH 1
−60
Vn
−70
In
10
100
Input = CH 1
Output = CH 2
−80
1
1k
10 k
100 k
−90
100 k
1M
10 M
100 M
500 M
f − Frequency − Hz
f − Frequency − Hz
Figure 16.
10
1 kΩ
1 kΩ
40
100 M
20
I n − Current Noise − pA/ Hz
VCC = ± 15 V
80
0
10
Vn − Voltage Noise − nV/ Hz
PRODUCT PREVIEW
0
VCC = ± 5 V
100
Figure 17.
Submit Documentation Feedback
Copyright © 1999–2007, Texas Instruments Incorporated
Product Folder Link(s): THS6062
�THS6062
www.ti.com
SLOS228D – JANUARY 1999 – REVISED OCTOBER 2007
HARMONIC DISTORTION
vs
FREQUENCY
−60
Third Harmonic
−70
−80
VCC = ± 15 V and ± 5 V
Gain = 2
RF = 300 Ω
RL = 150 Ω
VO(PP) = 2 V
−50
Harmonic Distortion − dBc
−50
Harmonic Distortion − dBc
−40
VCC = ± 15 V and ± 5 V
Gain = 2
RF = 300 Ω
RL = 1 kΩ
VO(PP) = 2 V
Second Harmonic
−90
−100
−60
Second Harmonic
−70
−80
−90
−100
−110
100 k
1M
Third Harmonic
−110
100 k
10 M
1M
Figure 18.
Figure 19.
HARMONIC DISTORTION
vs
PEAK-TO-PEAK OUTPUT VOLTAGE
HARMONIC DISTORTION
vs
PEAK-TO-PEAK OUTPUT VOLTAGE
−10
−50
Third Harmonic
VCC = ± 15 V
Gain = 5
RF = 300 Ω
RL = 150 Ω
f = 1 MHz
−20
−60
−30
Harmonic Distortion − dBc
Harmonic Distortion − dBc
10 M
f − Frequency − Hz
f − Frequency − Hz
Second Harmonic
−70
−80
−90
VCC = ± 15 V
Gain = 5
RF = 300 Ω
RL = 1 kΩ
f = 1 MHz
−100
−110
0
2
4
6
8
10 12 14 16 18
VO(PP) − Peak-to-Peak Output Voltage − V
−40
−50
Second Harmonic
−60
−70
−80
−90
Third Harmonic
−100
−110
20
0
Figure 20.
2
4
6
8
10 12 14 16 18
VO(PP) − Peak-to-Peak Output Voltage − V
20
Figure 21.
Submit Documentation Feedback
Copyright © 1999–2007, Texas Instruments Incorporated
Product Folder Link(s): THS6062
11
PRODUCT PREVIEW
−40
HARMONIC DISTORTION
vs
FREQUENCY
�THS6062
www.ti.com
SLOS228D – JANUARY 1999 – REVISED OCTOBER 2007
SLEW RATE
vs
FREE-AIR TEMPERATURE
0.1% SETTLING TIME
vs
OUTPUT VOLTAGE STEP SIZE
80
120
Gain = −1
RL = 150 Ω
100
90
80
70
VCC = ± 5 V
Step = 4 V
60
VCC = ± 2.5 V
Step = 2 V
50
0
20
40
60
80
TA − Free-Air Temperature − °C
50
VCC = ± 15 V
40
30
20
4
2
3
VO − Output Voltage Step Size − V
1
100
Figure 22.
Figure 23.
OUTPUT AMPLITUDE
vs
FREQUENCY
OUTPUT AMPLITUDE
vs
FREQUENCY
5
8
7
RF = 1 kΩ
6
5
Output Amplitude − dB
Output Amplitude − dB
PRODUCT PREVIEW
−20
7
RF = 300 Ω
4
RF = 100 Ω
3
2
VCC = ± 15 V
Gain = 2
RL = 150 Ω
VO(PP) = 0.4 V
−1
100 k
12
VCC = ± 5 V
10
8
0
VCC = ± 2.5 V
60
0
40
−40
1
Gain = −1
RF = 430 Ω
70
t s − 0.1% Settling Time − ns
SR − Slew Rate − V/ m s
110
VCC = ± 15 V
Step = 20 V
1M
6
5
500 M
RF = 100 Ω
3
2
0
100 M
RF = 300 Ω
4
1
10 M
RF = 1 kΩ
VCC = ± 5 V
Gain = 2
RL = 150 Ω
VO(PP) = 0.4 V
−1
100 k
1M
10 M
f − Frequency − Hz
f − Frequency − Hz
Figure 24.
Figure 25.
Submit Documentation Feedback
100 M
500 M
Copyright © 1999–2007, Texas Instruments Incorporated
Product Folder Link(s): THS6062
�THS6062
www.ti.com
SLOS228D – JANUARY 1999 – REVISED OCTOBER 2007
OUTPUT AMPLITUDE
vs
FREQUENCY
OUTPUT AMPLITUDE
vs
FREQUENCY
2
1
RF = 1 kΩ
6
5
Output Amplitude − dB
Output Amplitude − dB
7
RF = 300 Ω
RF = 100 Ω
4
3
2
1
0
VCC = ± 2.5 V
Gain = 2
RL = 150 Ω
VO(PP) = 0.4 V
−1
100 k
1M
100 M
RF = 100 Ω
−2
−3
−4
VCC = ± 15 V
Gain = −1
RL = 150 Ω
VO(PP) = 0.4 V
−7
100 k
500 M
1M
10 M
f − Frequency − Hz
Figure 26.
Figure 27.
OUTPUT AMPLITUDE
vs
FREQUENCY
OUTPUT AMPLITUDE
vs
FREQUENCY
100 M
500 M
100 M
500 M
2
1
RF = 1 kΩ
0
−1
Output Amplitude − dB
Output Amplitude − dB
RF = 360 Ω
f − Frequency − Hz
1
RF = 360 Ω
RF = 100 Ω
−2
−3
−4
−6
−1
−6
2
−5
0
−5
10 M
RF = 1 kΩ
VCC = ± 5 V
Gain = −1
RL = 150 Ω
VO(PP) = 0.4 V
−7
100 k
1M
0
−1
500 M
RF = 100 Ω
−3
−4
−6
100 M
RF = 360 Ω
−2
−5
10 M
RF = 1 kΩ
VCC = ± 2.5 V
Gain = −1
RL = 150 Ω
VO(PP) = 0.4 V
−7
100 k
1M
10 M
f − Frequency − Hz
f − Frequency − Hz
Figure 28.
Figure 29.
Submit Documentation Feedback
Copyright © 1999–2007, Texas Instruments Incorporated
Product Folder Link(s): THS6062
13
PRODUCT PREVIEW
8
�THS6062
www.ti.com
SLOS228D – JANUARY 1999 – REVISED OCTOBER 2007
OUTPUT AMPLITUDE
vs
FREQUENCY
16
VCC = ± 15 V
Output Amplitude − dB
14
12
10
VCC = ± 2.5 V
8
6
Gain = 5
RF = 3.9 kΩ
RL = 150 Ω
VO(PP) = 0.4 V
4
2
1M
100 M
10 M
500 M
f − Frequency − Hz
Figure 30.
SMALL AND LARGE SIGNAL
FREQUENCY RESPONSE
SMALL AND LARGE SIGNAL
FREQUENCY RESPONSE
3
3
VI = 0.5 V RMS
VCC = ± 15 V
Gain = 2
RF = 300 Ω
RL= 150 Ω
−3
−6
0
VO − Output Voltage Level − dBV
0
VO − Output Voltage Level − dBV
PRODUCT PREVIEW
0
100 k
VI = 0.25 V RMS
−9
−12
VI = 125 mV RMS
−15
−18
VI = 62.5 mV RMS
−21
−24
100 k
14
VI = 0.5 V RMS
VCC = ± 5 V
Gain = 2
RF = 300 Ω
RL = 150 Ω
−3
−6
VI = 0.25 V RMS
−9
−12
VI = 125 mV RMS
−15
−18
VI = 62.5 mV RMS
−21
1M
10 M
100 M
500 M
−24
100 k
1M
10 M
f − Frequency − Hz
f − Frequency − Hz
Figure 31.
Figure 32.
Submit Documentation Feedback
100 M
500 M
Copyright © 1999–2007, Texas Instruments Incorporated
Product Folder Link(s): THS6062
�THS6062
www.ti.com
SLOS228D – JANUARY 1999 – REVISED OCTOBER 2007
SMALL AND LARGE SIGNAL
FREQUENCY RESPONSE
−3
−9
VI = 0.25 V RMS
−12
−15
VI = 125 mV RMS
18
−21
VI = 62.5 mV RMS
−24
−9
VI = 0.25 V RMS
−12
−15
VI = 125 mV RMS
18
−21
VI = 62.5 mV RMS
−24
−27
−30
100 k
1M
10 M
100 M
−30
100 k
500 M
1M
f − Frequency − Hz
Figure 33.
Figure 34.
1-V STEP RESPONSE
100 M
500 M
800
1000
1-V STEP RESPONSE
0.6
0.6
VCC = ± 15 V
Gain = 2
RF = 300 Ω
RL = 150 Ω
See Figure 2
0.4
VO − Output Voltage − V
0.4
VO − Output Voltage − V
10 M
f − Frequency − Hz
PRODUCT PREVIEW
−27
VCC = ± 5 V
Gain = −1
RF = 430 Ω
RL = 150 Ω
VI = 0.5 V RMS
−6
VO − Output Voltage Level − dBV
VO − Output Voltage Level − dBV
−3
VCC = ± 15 V
Gain = −1
RF = 430 Ω
RL = 150 Ω
VI = 0.5 V RMS
−6
SMALL AND LARGE SIGNAL
FREQUENCY RESPONSE
0.2
0
−0.2
VCC = ± 2.5 V
Gain = 2
RF = 300 Ω
RL = 150 Ω
See Figure 2
−0.4
0.2
0
−0.2
−0.4
−0.6
−0.6
0
50
100
150
200
250
300
0
200
400
600
t − Time − ns
t − Time − ns
Figure 35.
Figure 36.
Submit Documentation Feedback
Copyright © 1999–2007, Texas Instruments Incorporated
Product Folder Link(s): THS6062
15
�THS6062
www.ti.com
SLOS228D – JANUARY 1999 – REVISED OCTOBER 2007
4-V STEP RESPONSE
20-V STEP RESPONSE
2.5
15
2
10
VO − Output Voltage − V
VO − Output Voltage − V
1.5
1
0.5
0
−0.5
VCC = ± 5 V
Gain = −1
RF = 430 Ω
RL = 150 Ω
See Figure 3
−1
−1.5
−2
0
RL = 150 Ω
−5
−10
−2.5
−15
0
PRODUCT PREVIEW
16
RL = 1 kΩ
5
VCC = ± 15 V
Gain = 2
RF = 330 Ω
See Figure 2
Offset For Clarity
200
400
600
800
1000
0
200
400
600
t − Time − ns
t − Time − ns
Figure 37.
Figure 38.
Submit Documentation Feedback
800
1000
Copyright © 1999–2007, Texas Instruments Incorporated
Product Folder Link(s): THS6062
�THS6062
www.ti.com
SLOS228D – JANUARY 1999 – REVISED OCTOBER 2007
APPLICATION INFORMATION
THEORY OF OPERATION
The THS6062 is a high-speed, operational amplifier configured in a voltage-feedback architecture. It is built using
a 30-V, dielectrically isolated, complementary bipolar process with NPN and PNP transistors possessing fTs of
several GHz. This results in an exceptionally high-performance amplifier that has a wide bandwidth, high slew
rate, fast settling time, and low distortion. A simplified schematic is shown in Figure 39.
(7) VCC +
(1,7) OUT
IN + (3,5)
(4) VCC −
Figure 39. THS6062 Simplified Schematic
The ADSL remote terminal receive band consists of 255 separate carrier frequencies each with its own
modulation and amplitude level. With such an implementation, it is imperative that signals received off the
telephone line have as high a signal-to-noise ratio (SNR) as possible. This is because of the numerous sources
of interference on the line. The best way to accomplish this high SNR is to have a low-noise receiver on the
front-end. It is also important to have the lowest distortion possible to help minimize against interference within
the ADSL carriers. The THS6062 was designed with these two priorities in mind.
By taking advantage of the superb characteristics of the complimentary bipolar process (BICOM), the THS6062
offers extremely low noise and distortion while maintaining a high bandwidth. There are some aspects that help
minimize distortion in any amplifier. The first is to extend the bandwidth of the amplifier as high as possible
without peaking. This allows the amplifier to eliminate any nonlinearities in the output signal. Another thing that
helps to minimize distortion is to increase the load impedance seen by the amplifier, thereby reducing the
currents in the output stage. This will help keep the output transistors in their linear amplification range and will
also reduce the heating effects. This can be seen in Figure 18 to Figure 21, which show a 1-kΩ load distortion is
much better than a 150-Ω load.
Submit Documentation Feedback
Copyright © 1999–2007, Texas Instruments Incorporated
Product Folder Link(s): THS6062
17
PRODUCT PREVIEW
IN − (2,6)
�THS6062
www.ti.com
SLOS228D – JANUARY 1999 – REVISED OCTOBER 2007
One client-side terminal circuit implementation, shown in Figure 40, uses a 1:2 transformer ratio. While creating a
power and output voltage advantage for the line drivers, the 1:2 transformer ratio reduces the SNR for the
received signals. The ADSL standard, ANSI T1.413, stipulates a noise power spectral density of –140 dBm/Hz,
which is equivalent to 31.6 nV/√Hz for a 100-Ω system. Although many amplifiers can reach this level of
performance, actual ADSL system testing has indicated that the noise power spectral density may typically be ≤
–150 dBm/Hz, or ≤ 10 nV/√Hz. With a transformer ratio of 1:2, this number reduces to less than 5 nV/√Hz. The
THS6062, with an equivalent input noise of 1.6 nV/√Hz, is an excellent choice for this application. Coupled with a
very low 1.2 pA/√Hz equivalent input current noise and low value resistors, the THS6062 will ensure that the
received signal SNR will be as high as possible.
6V
+
THS6022
Driver 1
VI+
0.1 mF
6.8 mF
12.5 Ω
+
_
1:2
1 kΩ
Telephone Line
1 kΩ
PRODUCT PREVIEW
0.1 mF
100 Ω
6.8 mF
+
−6 V
6V
+
THS6022
Driver 2
VI−
0.1 mF
1 kΩ
6.8 mF
12.5 Ω
+
_
499 Ω
499 Ω
−
+
THS6062
Receiver 1
VO+
1 kΩ
1 kΩ
0.1 mF
499 Ω
6.8 mF
+
6V
−6 V
1 kΩ
Driver Block
0.1 mF
499 Ω
−
VO−
+
THS6062
Receiver 2
−6 V
0.01 mF
Receiver Block
Figure 40. THS6062 Client-Side ADSL Application
18
Submit Documentation Feedback
Copyright © 1999–2007, Texas Instruments Incorporated
Product Folder Link(s): THS6062
�THS6062
www.ti.com
SLOS228D – JANUARY 1999 – REVISED OCTOBER 2007
NOISE CALCULATIONS AND NOISE FIGURE
Noise can cause errors on very small signals. This is especially true for the amplifying small signals. The noise
model for current-feedback amplifiers (CFB) is the same as voltage-feedback amplifiers (VFB). The only
difference between the two is that the CFB amplifiers generally specify different noise-current parameters for
each input, while VFB amplifiers usually only specify one noise-current parameter. The noise model is shown in
Figure 41. This model includes all of the noise sources as follows:
• en = Amplifier internal voltage noise (nV/√Hz)
• IN+ = Noninverting current noise (pA/√Hz)
• IN– = Inverting current noise (pA/√Hz)
• eRx = Thermal voltage noise associated with each resistor (eRx = 4 kTRx)
en
Noiseless
+
_
eni
IN+
eno
eRf
RF
eRg
IN−
RG
Figure 41. Noise Model
The total equivalent input noise density (eni) is calculated by using the following equation:
e
ni
+
Ǹ
ǒenǓ ) ǒIN )
2
R
Ǔ
S
2
ǒ
) IN–
ǒR F ø R G ǓǓ
2
ǒ
) 4 kTRs ) 4 kT R ø R
F
G
Ǔ
(1)
Where:
k = Boltzmann's constant = 1.380658 × 10⁻²³
T = Temperature in degrees Kelvin (273 + °C)
RF || RG = Parallel resistance of RF and RG
To get the equivalent output noise of the amplifier, just multiply the equivalent input noise density (eni) by the
overall amplifier gain (AV).
e no + e
ni
A
V
ǒ
+ e ni 1 )
Ǔ
RF
(Noninverting Case)
RG
(2)
As the previous equations show, to keep noise at a minimum, small-value resistors should be used. As the
closed-loop gain is increased (by reducing RG), the input noise is reduced considerably because of the parallel
resistance term. This leads to the general conclusion that the most dominant noise sources are the source
resistor S) and the internal amplifier noise voltage (en). Because noise is summed in a root-mean-squares
method, noise sources smaller than 25% of the largest noise source can be effectively ignored. This can greatly
simplify the formula and make noise calculations much easier to calculate.
For more information on noise analysis, refer to the Noise Analysis section in Operational Amplifier Circuits
Applications Report (SLVA043).
This brings up another noise measurement usually preferred in RF applications, the noise figure (NF). Noise
figure is a measure of noise degradation caused by the amplifier. The value of the source resistance must be
defined and is typically 50 Ω in RF applications.
Submit Documentation Feedback
Copyright © 1999–2007, Texas Instruments Incorporated
Product Folder Link(s): THS6062
19
PRODUCT PREVIEW
eRs
RS
�THS6062
www.ti.com
SLOS228D – JANUARY 1999 – REVISED OCTOBER 2007
NF +
ȱ e 2ȳ
10logȧ ni ȧ
ȧ 2ȧ
ȲǒeRsǓ ȴ
(3)
Because the dominant noise components are generally the source resistance and the internal amplifier noise
voltage, we can approximate the noise figure as:
NF +
ȱ ȡǒ Ǔ2 ǒ
ȧ en ) IN )
ȧ
Ȣ
ȧ
10logȧ1 )
4 kTR
ȧ
S
ȧ
Ȳ
Ǔ ȣȳ
S ȧȧ
Ȥȧ
ȧ
ȧ
ȧ
ȴ
2
R
(4)
Figure 42 shows the noise figure graph for the THS6062.
PRODUCT PREVIEW
NOISE FIGURE
vs
SOURCE RESISTANCE
16
f = 10 kHz
TA = 25°C
14
Noise Figure − dB
12
10
8
6
4
2
0
10
1k
100
Source Resistance − Ω
10 k
Figure 42. Noise Figure vs Source Resistance
20
Submit Documentation Feedback
Copyright © 1999–2007, Texas Instruments Incorporated
Product Folder Link(s): THS6062
�THS6062
www.ti.com
SLOS228D – JANUARY 1999 – REVISED OCTOBER 2007
OPTIMIZING FREQUENCY RESPONSE
Internal frequency compensation of the THS6062 was selected to provide very wide bandwidth performance and
still maintain a very low noise floor. In order to meet these performance requirements, the THS6062 must have a
minimum gain of 2 (–1). Because everything is referred to the noninverting terminal of an operational amplifier,
the noise gain in a G = –1 configuration is the same as in a G = 2 configuration.
One of the keys to maintaining a smooth frequency response, and hence, a stable pulse response, is to pay
particular attention to the inverting terminal. Any stray capacitance at this node causes peaking in the frequency
response (see Figure 43 and Figure 44). There are two things that can be done to help minimize this effect. The
first is to simply remove any ground planes under the inverting terminal of the amplifier. This also includes the
trace that connects to this terminal. Additionally, the length of this trace should be minimized. The capacitance at
this node causes a lag in the voltage being fed back due to the charging and discharging of the stray
capacitance. If this lag becomes too long, the amplifier will not be able to correctly keep the noninverting terminal
voltage at the same potential as the inverting terminal's voltage. Peaking and possibly oscillations will then occur.
Output Amplitude − dB
8
7
CIN− = 10 pF
3
2
Output Amplitude − dB
9
4
VCC = ± 15 V
Gain = 2
RF = 300 Ω
RL = 150 Ω
VO(PP) = 0.4 V
6
No CIN−
(Stray C Only)
5
4
3
2
CIN−
300 Ω
300 Ω
VI
1M
VO
+
50 Ω
1
0
100 k
_
VCC = ± 15 V
Gain = −1
RF = 360 Ω
RL = 150 Ω
VO(PP) = 0.4 V
CIN− = 10 pF
1
0
No CIN−
(Stray C Only)
−1
−2
−3
−4
360 Ω
VI
56 Ω
360 Ω
_
CIN−
VO
+
150 Ω
150 Ω
−5
100 M
10 M
500 M
−6
100 k
1M
10 M
f − Frequency − Hz
f − Frequency − Hz
Figure 43.
Figure 44.
100 M
500 M
The next thing that helps to maintain a smooth frequency response is to keep the feedback resistor f) and the
gain resistor g) values fairly low. These two resistors are effectively in parallel when looking at the ac small-signal
response. This is why in Figure 30, a feedback resistor of 3.9 kΩ with a gain resistor of 1 kΩ only shows a small
peaking in the frequency response. The parallel resistance is only 800 Ω. This value, in conjunction with a very
small stray capacitance test PCB, forms a zero on the edge of the amplifier's natural frequency response. To
eliminate this peaking, all that needs to be done is to reduce the feedback and gain resistances. One other way
to compensate for this stray capacitance is to add a small capacitor in parallel with the feedback resistor. This
helps to neutralize the effects of the stray capacitance. To keep this zero out of the operating range, the stray
capacitance and resistor value's time constant must be kept low. But, as can be seen in Figure 23 to Figure 28, a
value too low starts to reduce the bandwidth of the amplifier. Table 1 shows some recommended feedback
resistors to be used with the THS6062.
Table 1. Recommended Feedback Resistors
GAIN
Rf for VCC = ±15 V, ±5 V, 5 V
2
300 Ω
–1
360 Ω
5
3.3 kΩ (low stray-c PCB only)
Submit Documentation Feedback
Copyright © 1999–2007, Texas Instruments Incorporated
Product Folder Link(s): THS6062
21
PRODUCT PREVIEW
10
�THS6062
www.ti.com
SLOS228D – JANUARY 1999 – REVISED OCTOBER 2007
DRIVING A CAPACITIVE LOAD
Driving capacitive loads with high performance amplifiers is not a problem as long as certain precautions are
taken. The first is to realize that the THS6062 has been internally compensated to maximize its bandwidth and
slew rate performance. When the amplifier is compensated in this manner, capacitive loading directly on the
output will decrease the device's phase margin leading to high frequency ringing or oscillations. Therefore, for
capacitive loads of greater than 10 pF, it is recommended that a resistor be placed in series with the output of
the amplifier, as shown in Figure 45. A minimum value of 20 Ω should work well for most applications. For
example, in 75-Ω transmission systems, setting the series resistor value to 75 Ω both isolates any capacitance
loading and provides the proper line impedance matching at the source end.
360 Ω
360 Ω
Input
_
20 Ω
Output
THS6062
+
CLOAD
PRODUCT PREVIEW
Figure 45. Driving a Capacitive Load
OFFSET VOLTAGE
The output offset voltage, (VOO) is the sum of the input offset voltage (VIO) and both input bias currents (IIB) times
the corresponding gains. The following schematic and formula are used to calculate the output offset voltage:
Figure 46. Output Offset Voltage Model
22
Submit Documentation Feedback
Copyright © 1999–2007, Texas Instruments Incorporated
Product Folder Link(s): THS6062
�THS6062
www.ti.com
SLOS228D – JANUARY 1999 – REVISED OCTOBER 2007
In order to achieve the high-frequency performance of the THS6062, it is essential that proper printed-circuit
board high frequency design techniques be followed. A general set of guidelines is given below. In addition, a
THS6062 evaluation board is available to use as a guide for layout or for evaluating the device performance.
• Ground planes—It is highly recommended that a ground plane be used on the board to provide all
components with a low inductive ground connection. However, in the areas of the amplifier inputs and output,
the ground plane can be removed to minimize the stray capacitance.
• Proper power supply decoupling—Use a 6.8-μF tantalum capacitor in parallel with a 0.1-μF ceramic capacitor
on each supply terminal. It may be possible to share the tantalum capacitor among several amplifiers
depending on the application, but a 0.1-μF ceramic capacitor should always be used on the supply terminal of
every amplifier. In addition, the 0.1-μF capacitor should be placed as close as possible to the supply terminal.
As this distance increases, the inductance in the connecting trace makes the capacitor less effective. The
designer should strive for distances of less than 0.1 inches between the device power terminals and the
ceramic capacitors.
• Sockets—Sockets are not recommended for high-speed operational amplifiers. The additional lead
inductance in the socket pins will often lead to stability problems. Surface-mount packages soldered directly
to the printed-circuit board is the best implementation.
• Short trace runs/compact part placements—Optimum high frequency performance is achieved when stray
series inductance has been minimized. To realize this, the circuit layout should be made as compact as
possible, thereby minimizing the length of all trace runs. Particular attention should be paid to the inverting
input of the amplifier. Its length should be kept as short as possible. This will help to minimize stray
capacitance at the input of the amplifier.
• Surface-mount passive components—Using surface-mount passive components is recommended for high
frequency amplifier circuits for several reasons. First, because of the extremely low lead inductance of
surface-mount components, the problem with stray series inductance is greatly reduced. Second, the small
size of surface-mount components naturally leads to a more compact layout, thereby minimizing both stray
inductance and capacitance. If leaded components are used, it is recommended that the lead lengths be kept
as short as possible.
Submit Documentation Feedback
Copyright © 1999–2007, Texas Instruments Incorporated
Product Folder Link(s): THS6062
23
PRODUCT PREVIEW
CIRCUIT LAYOUT CONSIDERATIONS
�THS6062
www.ti.com
SLOS228D – JANUARY 1999 – REVISED OCTOBER 2007
GENERAL PowerPAD DESIGN CONSIDERATIONS
The THS6062 is available packaged in a thermally-enhanced DGN package, which is a member of the
PowerPAD family of packages. This package is constructed using a downset leadframe upon which the die is
mounted [see Figure 47(a) and Figure 47(b)]. This arrangement results in the lead frame being exposed as a
thermal pad on the underside of the package [see Figure 47)]. Because this thermal pad has direct thermal
contact with the die, excellent thermal performance can be achieved by providing a good thermal path away from
the thermal pad.
The PowerPAD package allows for both assembly and thermal management in one manufacturing operation.
During the surface-mount solder operation (when the leads are being soldered), the thermal pad can also be
soldered to a copper area underneath the package. Through the use of thermal paths within this copper area,
heat can be conducted away from the package into either a ground plane or other heat dissipating device.
The PowerPAD package represents a breakthrough in combining the small area and ease of assembly of
surface mount with the, heretofore, awkward mechanical methods of heat sinking.
DIE
Side View (a)
Thermal
Pad
PRODUCT PREVIEW
DIE
End View (b)
Bottom View (c)
Figure 47. Views of Thermally Enhanced DGN Package
Although there are many ways to properly heat sink this device, the following steps illustrate the recommended
approach.
Thermal pad area (68 mils x 70 mils) with 5 vias
(Via diameter = 13 mils)
Figure 48. PowerPAD PCB Etch and Via Pattern
1. Prepare the PCB with a top side etch pattern as shown in Figure 48. There should be etch for the leads as
well as etch for the thermal pad.
2. Place five holes in the area of the thermal pad. These holes should be 13 mils in diameter. They are kept
small so that solder wicking through the holes is not a problem during reflow.
3. Additional vias may be placed anywhere along the thermal plane outside of the thermal pad area. This helps
dissipate the heat generated by the THS6062DGN IC. These additional vias may be larger than the 13-mil
diameter vias directly under the thermal pad. They can be larger because they are not in the thermal pad
area to be soldered so that wicking is not a problem.
4. Connect all holes to the internal ground plane.
5. When connecting these holes to the ground plane, do not use the typical web or spoke via connection
methodology. Web connections have a high thermal resistance connection that is useful for slowing the heat
transfer during soldering operations. This makes the soldering of vias that have plane connections easier. In
this application, however, low thermal resistance is desired for the most efficient heat transfer. Therefore, the
holes under the THS6062DGN package should make their connection to the internal ground plane with a
complete connection around the entire circumference of the plated-through hole.
6. The top-side solder mask should leave the terminals of the package and the thermal pad area with its five
holes exposed. The bottom-side solder mask should cover the five holes of the thermal pad area. This
prevents solder from being pulled away from the thermal pad area during the reflow process.
7. Apply solder paste to the exposed thermal pad area and all of the IC terminals.
8. With these preparatory steps in place, the THS6062DGN IC is simply placed in position and run through the
solder reflow operation as any standard surface-mount component. This results in a part that is properly
24
Submit Documentation Feedback
Copyright © 1999–2007, Texas Instruments Incorporated
Product Folder Link(s): THS6062
�THS6062
www.ti.com
SLOS228D – JANUARY 1999 – REVISED OCTOBER 2007
installed.
The actual thermal performance achieved with the THS6062DGN in its PowerPAD package depends on the
application. In the example above, if the size of the internal ground plane is approximately 3 inches × 3 inches,
then the expected thermal coefficient, θJA, is about 58.4°C/W. For comparison, the non-PowerPAD version of the
THS6062 IC (SOIC) is shown. For a given θJA, the maximum power dissipation is shown in Figure 49 and is
calculated by the following formula:
ǒ
T
P
D
+
–T
MAX A
q
JA
Ǔ
(5)
Where:
PD = Maximum power dissipation of THS6062 IC (watts)
TMAX = Absolute maximum junction temperature (150°C)
TA = Free-ambient air temperature (°C)
θJA = θJC + θCA
θJC = Thermal coefficient from junction to case
θCA = Thermal coefficient from case to ambient air (°C/W)
Maximum Power Dissipation − W
3.5
DGN Package
θJA = 58.4°C/W
2 oz. Trace And Copper Pad
With Solder
3
2.5
SOIC Package
High-K Test PCB
θJA = 98°C/W
2
PRODUCT PREVIEW
MAXIMUM POWER DISSIPATION
vs
FREE-AIR TEMPERATURE
TJ = 150°C
DGN Package
θJA = 158°C/W
2 oz. Trace And
Copper Pad
Without Solder
1.5
1
0.5
SOIC Package
Low-K Test PCB
θJA = 167°C/W
0
−40
−20
0
20
40
60
80
TA − Free-Air Temperature − °C
100
NOTE: Results are with no air flow and PCB size = 3"× 3"
Figure 49. Maximum Power Dissipation vs Free-Air Temperature
More complete details of the PowerPAD installation process and thermal management techniques can be found
in the Texas Instruments Technical Brief, PowerPAD Thermally Enhanced Package. This document can be found
at the TI web site (www.ti.com) by searching on the key word PowerPAD. The document can also be ordered
through your local TI sales office. Refer to literature number SLMA002 when ordering.
The next thing that should be considered is the package constraints. The two sources of heat within an amplifier
are quiescent power and output power. The designer should never forget about the quiescent heat generated
within the device, especially a multi-amplifier device. Because these devices have linear output stages (Class
A-B), most of the heat dissipation is at low output voltages with high output currents. Figure 50 and Figure 51
show this effect, along with the quiescent heat, with an ambient air temperature of 50°C. When using VCC = 5 V
or ±5 V, there is generally not a heat problem, even with SOIC packages. But, when using VCC = ±15 V, the
SOIC package is severely limited in the amount of heat it can dissipate. The other key factor when looking at
these graphs is how the devices are mounted on the PCB. The PowerPAD devices are extremely useful for heat
Submit Documentation Feedback
Copyright © 1999–2007, Texas Instruments Incorporated
Product Folder Link(s): THS6062
25
�THS6062
www.ti.com
SLOS228D – JANUARY 1999 – REVISED OCTOBER 2007
dissipation. But the device should always be soldered to a copper plane to fully use the heat dissipation
properties of the PowerPAD. The SOIC package, on the other hand, is highly dependent on how it is mounted on
the PCB. As more trace and copper area is placed around the device, θJA decreases and the heat dissipation
capability increases. The currents and voltages shown in these graphs are for the total package. Because the
THS6062 is a dual amplifier, the sum of the RMS output currents and voltages should be used to choose the
proper package.
180
1000
Maximum Output
Current Limit Line
Package With
θJA ≤ 60°C/W
| IO | − Maximum RMS Output Current − mA
PRODUCT PREVIEW
| IO |− Maximum RMS Output Current − mA
200
160
140
120
100
SO-8 Package
θJA = 167°C/W
Low-K Test PCB
80
60
Safe Operating Area
40
SO-8 Package
θJA = 98°C/W
High-K Test PCB
20
0
0
VCC = ± 5 V
TJ = 150°C
TA = 50°C
Both Channels
1
2
3
4
| VO | − RMS Output Voltage − V
5
VCC = ± 15 V
TJ = 150°C
TA = 50°C
Both Channels
Maximum Output
Current Limit Line
100
SO-8 Package
θJA = 98°C/W
High-K Test PCB
10
DGN Package
θJA = 58.4°C/W
Safe Operating Area
1
0
Figure 50.
SO-8 Package
θJA = 167°C/W
Low-K Test PCB
3
6
9
12
| VO | − RMS Output Voltage − V
15
Figure 51.
EVALUATION BOARD
An evaluation board is available for the THS6062 (SLOP221). This board has been configured for very low
parasitic capacitance in order to realize the full performance of the amplifier. For more information, refer to the
THS6062 EVM User's Guide (SLOU036) To order the evaluation board contact your local TI sales office or
distributor.
26
Submit Documentation Feedback
Copyright © 1999–2007, Texas Instruments Incorporated
Product Folder Link(s): THS6062
�PACKAGE OPTION ADDENDUM
www.ti.com
14-Oct-2022
PACKAGING INFORMATION
Orderable Device
Status
(1)
Package Type Package Pins Package
Drawing
Qty
Eco Plan
(2)
Lead finish/
Ball material
MSL Peak Temp
Op Temp (°C)
Device Marking
(3)
Samples
(4/5)
(6)
THS6062CD
ACTIVE
SOIC
D
8
75
RoHS & Green
NIPDAU
Level-1-260C-UNLIM
0 to 70
6062C
Samples
THS6062CDGNR
ACTIVE
HVSSOP
DGN
8
2500
RoHS & Green
NIPDAU
Level-1-260C-UNLIM
0 to 70
ABE
Samples
THS6062ID
ACTIVE
SOIC
D
8
75
RoHS & Green
NIPDAU
Level-1-260C-UNLIM
-40 to 85
6062I
Samples
THS6062IDGNR
ACTIVE
HVSSOP
DGN
8
2500
RoHS & Green
NIPDAU
Level-1-260C-UNLIM
ABH
Samples
(1)
The marketing status values are defined as follows:
ACTIVE: Product device recommended for new designs.
LIFEBUY: TI has announced that the device will be discontinued, and a lifetime-buy period is in effect.
NRND: Not recommended for new designs. Device is in production to support existing customers, but TI does not recommend using this part in a new design.
PREVIEW: Device has been announced but is not in production. Samples may or may not be available.
OBSOLETE: TI has discontinued the production of the device.
(2)
RoHS: TI defines "RoHS" to mean semiconductor products that are compliant with the current EU RoHS requirements for all 10 RoHS substances, including the requirement that RoHS substance
do not exceed 0.1% by weight in homogeneous materials. Where designed to be soldered at high temperatures, "RoHS" products are suitable for use in specified lead-free processes. TI may
reference these types of products as "Pb-Free".
RoHS Exempt: TI defines "RoHS Exempt" to mean products that contain lead but are compliant with EU RoHS pursuant to a specific EU RoHS exemption.
Green: TI defines "Green" to mean the content of Chlorine (Cl) and Bromine (Br) based flame retardants meet JS709B low halogen requirements of


 工商网监
湘ICP备2023018690号
工商网监
湘ICP备2023018690号
