���������
SLOS406A − FEBRUARY 2003 − REVISED MARCH 2003
��
����
���
�� ����
�
�� ���������
��� �� �
���� �
���
�
FEATURES
D 3-W/Ch Into an 8-Ω Load From 12-V Supply
D Efficient, Class-D Operation Eliminates
Heatsinks and Reduces Power Supply
Requirements
32-Step DC Volume Control From −40 dB
to 36 dB
Third Generation Modulation Techniques
− Replaces Large LC Filter With Small
Low-Cost Ferrite Bead Filter
Thermal and Short-Circuit Protection
Stereo speaker volume is controlled with a dc voltage
applied to the volume control terminal offering a range
of gain from –40 dB to 36 dB.
D
APPLICATIONS
D LCD Monitors and TVs
D Powered Speakers
10 µF
Cs
0.1 µF
Cs
0.1 µF
PVCCR
PVCCR
PGNDR
ROUTN
PGNDR
PVCCR
NC
LINN
MUTE CONTROL
AVCC
Cs
0.1 µF
Cvcc
10 µF
NC
TPA3003D2
AVDDREF
FADE
AGND
COSC
AGND
ROSC
VOLUME
AGND
REFGND
VCLAMPL
Cs
Cbs
10 nF
PVCC
0.1 µF
PVCCL
AVDD
PVCCL
VREF
BSLN
VOLUME
LINP
LOUTP
1 µF
AVCC
LOUTP
LINN
1 µF Clinn
V2P5
PGNDL
LINP
Clinp 1 µF
1 µF
MUTE
RINP
PGNDL
C2p5
Ccpr
VCLAMPR
RINN
LOUTN
1 µF
Cbs
NC
LOUTN
Crinp 1 µF
10 nF
Cs
SD
PVCCL
RINP
ROUTN
BSRN
RINN
Crinn
PVCCL
SYSTEM CONTROL
PVCCR
Cs
PVCC
ROUTP
Cbs
10 µF
ROUTP
PVCC
10 nF
BSRP
D
The TPA3003D2 is a 3-W (per channel) efficient,
Class-D audio amplifier for driving bridged-tied stereo
speakers. The TPA3003D2 can drive stereo speakers
as low as 8 Ω. The high efficiency of the TPA3003D2
eliminates the need for external heatsinks when playing
music.
BSLP
D
DESCRIPTION
AVDD
Cvdd
Cosc
100 nF
220 pF
SYSTEM CONTROL
Rosc
120 kΩ
Ccpl
1 µF
Cs
0.1 µF
Cs
Cs
10 µF
10 µF
Cbs
10 nF
PVCC
Please be aware that an important notice concerning availability, standard warranty, and use in critical applications of Texas Instruments
semiconductor products and disclaimers thereto appears at the end of this data sheet.
��
�����
� ���� ����������� �� !"��#�� �� �� $"%&�!����� '��#(
���'"!�� !������ �� �$#!���!������ $#� �)# �#��� �� �#*�� �����"�#���
����'��' +������,( ���'"!���� $��!#����- '�#� ��� �#!#�����&, ��!&"'#
�#����- �� �&& $����#�#��(
Copyright 2003, Texas Instruments Incorporated
www.ti.com
1
����������
SLOS406A − FEBRUARY 2003 − REVISED MARCH 2003
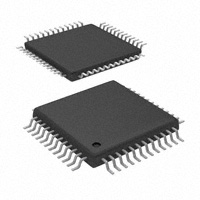
AVAILABLE OPTIONS
PACKAGED DEVICE
48-PIN TQFP (PFB)†
TA
−40°C to 85°C
TPA3003D2PFB
† The PFB package is available taped and reeled. To order a taped and
reeled part, add the suffix R to the part number (e.g., TPA3003D2PFBR).
PHP PACKAGE
2
PVCCR
41 40 39 38
37
ROUTP
BSRP
43 42
ROUTP
PGNDR
PGNDR
ROUTN
ROUTN
46 45 44
PVCCR
48 47
PVCCR
PVCCR
BSRN
(TOP VIEW)
SD
1
36
VCLAMPR
RINN
2
35
NC
RINP
3
34
MUTE
V2P5
4
33
AVCC
LINP
5
32
NC
LINN
6
31
NC
AVDDREF
7
30
FADE
VREF
8
29
AVDD
AGND
9
28
COSC
AGND
10
27
ROSC
VOLUME
11
26
AGND
REFGND
12
25
VCLAMPL
24
BSLP
PVCCL
LOUTP
PVCCL
PGNDL
www.ti.com
LOUTP
PVCCL
PGNDL
20 21 22 23
LOUTN
18 19
LOUTN
15 16 17
PVCCL
13 14
BSLN
TPA3003D2
����������
SLOS406A − FEBRUARY 2003 − REVISED MARCH 2003
functional block diagram
V2P5
PVCC
V2P5
VClamp
Gen
VCLAMPR
BSRN
PVCCR(2)
Gate
Drive
RINN
ROUTN(2)
PGNDR
BSRP
PVCCR(2)
Deglitch &
Gain
Adj.
Modulation
Logic
RINP
V2P5
Gate
Drive
VREF
VOLUME
Gain
Control
FADE
PGNDR
To Gain Adj.
Blocks
REFGND
Short Circuit
Detect
V2P5
ROSC
Ramp
Generator
Biases
Startup
Protection
Logic
&
COSC
References
AVDDREF
ROUTP(2)
Thermal
VDD
VDDok
AVCC
AVDD
VCCok
AVDD
5V LDO
PVCC
TTL Input
Buffer
SD
AVCC
AGND
VClamp
Gen
VCLAMPL
MUTE
BSLN
PVCCL(2)
Gate
Drive
Cint2
V2P5
LINN
Gain
Adj.
PGNDL
BSLP
PVCCL(2)
Deglitch &
Rfdbk2
Modulation
Logic
LINP
LOUTN(2)
Rfdbk2
Gate
Drive
Cint2
LOUTP(2)
PGNDL
www.ti.com
3
����������
SLOS406A − FEBRUARY 2003 − REVISED MARCH 2003
Terminal Functions
TERMINAL
NO.
NAME
AGND
9, 10, 26
AVCC
AVDD
AVDDREF
BSLN
BSLP
I/O
DESCRIPTION
−
Analog ground for digital/analog cells in core
33
−
High-voltage analog power supply (8.5 V to 14 V)
29
O
5-V Regulated output
7
O
5-V Reference output—provided for connection to adjacent VREF terminal.
13
I/O
Bootstrap I/O for left channel, negative high-side FET
24
I/O
Bootstrap I/O for left channel, positive high-side FET
BSRN
48
I/O
Bootstrap I/O for right channel, negative high-side FET
BSRP
37
I/O
Bootstrap I/O for right channel, positive high-side FET
COSC
28
I/O
I/O for charge/discharging currents onto capacitor for ramp generator triangle wave biased at V2P5
FADE
30
I
Input for controlling volume ramp rate when cycling SD or during power-up. A logic low on this pin places
the amplifier in fade mode. A logic high on this pin allows a quick transition to the desired volume setting.
LINN
6
I
Negative differential audio input for left channel
LINP
5
I
Positive differential audio input for left channel
LOUTN
16, 17
O
Class-D 1/2-H-bridge negative output for left channel
LOUTP
20, 21
O
Class-D 1/2-H-bridge positive output for left channel
MUTE
34
I
A logic high on this pin disables the outputs. A low on this pin enables the outputs.
NC
31, 32,
35
−
Not internally connected
PGNDL
18, 19
−
Power ground for left channel H-bridge
PGNDR
42, 43
−
Power ground for right channel H-bridge
PVCCL
14, 15
−
Power supply for left channel H-bridge (tied to pins 22 and 23 internally), not connected to PVCCR or
AVCC.
PVCCL
22, 23
−
Power supply for left channel H-bridge (tied to pins 14 and 15 internally), not connected to PVCCR or
AVCC.
PVCCR
38,39
−
PVCCR
46, 47
−
REFGND
12
−
Power supply for right channel H-bridge (tied to pins 46 and 47 internally), not connected to PVCCL or
AVCC.
Power supply for right channel H-bridge (tied to pins 38 and 39 internally), not connected to PVCCL or
AVCC.
Ground for gain control circuitry. Connect to AGND. If using a DAC to control the volume, connect the DAC
ground to this terminal.
RINP
3
I
Positive differential audio input for right channel
RINN
2
I
Negative differential audio input for right channel
ROSC
27
I/O
Current setting resistor for ramp generator. Nominally equal to 1/8*VCC
ROUTN
44, 45
O
Class-D 1/2-H-bridge negative output for right channel
ROUTP
40, 41
O
Class-D 1/2-H-bridge positive output for right channel
SD
1
I
Shutdown signal for IC (low = shutdown, high = operational). TTL logic levels with compliance to VCC.
VCLAMPL
25
−
Internally generated voltage supply for left channel bootstrap capacitors.
VCLAMPR
36
−
Internally generated voltage supply for right channel bootstrap capacitors.
VOLUME
11
I
DC voltage that sets the gain of the amplifier.
VREF
8
I
Analog reference for gain control section.
V2P5
4
O
2.5-V Reference for analog cells, as well as reference for unused audio input when using single-ended
inputs.
4
www.ti.com
����������
SLOS406A − FEBRUARY 2003 − REVISED MARCH 2003
absolute maximum ratings over operating free-air temperature range (unless otherwise noted)†
Supply voltage range: AVCC, PVCC . . . . . . . . . . . . . . . . . . . . . . . . . . . . . . . . . . . . . . . . . . . . . . . . . . . . . −0.3 V to 15 V
Input voltage range, VI: MUTE, VREF, VOLUME, FADE . . . . . . . . . . . . . . . . . . . . . . . . . . . . . . . . . . . . . . . . 0 V to 5.5 V
SD . . . . . . . . . . . . . . . . . . . . . . . . . . . . . . . . . . . . . . . . . . . . . . . . . . . . . . . . −0.3 V to VCC + 0.3 V
RINN, RINP, LINN, LINP . . . . . . . . . . . . . . . . . . . . . . . . . . . . . . . . . . . . . . . . . . . . −0.3 V to 7 V
Supply current,
AVDD . . . . . . . . . . . . . . . . . . . . . . . . . . . . . . . . . . . . . . . . . . . . . . . . . . . . . . . . . . . . . . . . . . 10 mA
AVDDREF . . . . . . . . . . . . . . . . . . . . . . . . . . . . . . . . . . . . . . . . . . . . . . . . . . . . . . . . . . . . . . 10 mA
Continuous total power dissipation . . . . . . . . . . . . . . . . . . . . . . . . . . . . . . . . . . . . . . . . . . See Dissipation Rating Table
Operating free-air temperature range, TA . . . . . . . . . . . . . . . . . . . . . . . . . . . . . . . . . . . . . . . . . . . . . . . . . . −40°C to 85°C
Operating junction temperature range, TJ . . . . . . . . . . . . . . . . . . . . . . . . . . . . . . . . . . . . . . . . . . . . . . . . −40°C to 150°C
Storage temperature range, Tstg . . . . . . . . . . . . . . . . . . . . . . . . . . . . . . . . . . . . . . . . . . . . . . . . . . . . . . . . −65°C to 150°C
Lead temperature 1,6 mm (1/16 inch) from case for 10 seconds . . . . . . . . . . . . . . . . . . . . . . . . . . . . . . . . . . . . . 260°C
† Stresses beyond those listed under “absolute maximum ratings” may cause permanent damage to the device. These are stress ratings only, and
functional operation of the device at these or any other conditions beyond those indicated under “recommended operating conditions” is not
implied. Exposure to absolute-maximum-rated conditions for extended periods may affect device reliability.
DISSIPATION RATING TABLE
PACKAGE
PFB
TA ≤ 25°C
2.8 W
DERATING FACTOR
22.2 mW/°C
TA = 70°C
1.8 W
TA = 85°C
1.4 W
recommended operating conditions
Supply voltage, VCC
Volume reference voltage
PVCC, AVCC
VREF
Volume control pins, input voltage
VOLUME
SD
High-level input voltage, VIH
MIN
MAX
UNIT
8.5
14
V
3.0
5.5
V
5.5
V
2
MUTE
3.5
FADE
4
SD
Low-level input voltage, VIL
High-level input current, IIH
V
0.8
MUTE
2
FADE
2
MUTE, VI= 5 V, VCC = 14 V
1
SD, VI= 14 V, VCC = 14 V
50
FADE, VI= 5 V, VCC = 14 V
V
µA
150
1
A
µA
Oscillator frequency, fOSC
225
275
kHz
Operating free-air temperature, TA
−40
85
°C
Low-level input current, IIL
MUTE, SD, FADE, VI= 0 V, VCC = 14 V
www.ti.com
5
����������
SLOS406A − FEBRUARY 2003 − REVISED MARCH 2003
dc characteristics, TA = 25°C, VCC = 12 V, RL = 8 Ω (unless otherwise noted)
PARAMETER
TEST CONDITIONS
| VOS |
Output offset voltage (measured
differentially)
INN and INP connected together,
Gain = 36 dB
V2P5 (terminal 4)
2.5-V Bias voltage
No load
PSRR
Power supply rejection ratio
ICC
ICC(MUTE)
Supply quiescent current
VCC = 11.5 V to 12.5 V
MUTE = 2 V, SD = 2 V
MUTE mode quiescent current
MUTE = 3.5 V, SD = 2 V
ICC(max power)
ICC(SD)
Supply current at max power
RL = 8 Ω, PO = 3 W
Supply current in shutdown mode
SD = 0.8 V
rds(on)
Drain-source on-state resistance
VCC = 12 V,
IO = 1 A,
TJ = 25°C
25 C
MIN
0.45x
AVDD
TYP
MAX
10
65
0.5x
AVDD
0.55x
AVDD
−80
UNIT
mV
V
dB
16
28.5
mA
7
9
mA
0.6
A
ÁÁÁÁÁÁÁÁÁÁÁÁÁÁÁÁÁÁÁÁÁÁÁÁÁÁÁÁÁÁÁÁÁÁÁÁÁÁÁÁÁ
ÁÁÁÁÁÁÁÁÁÁÁÁÁÁÁÁÁÁÁÁÁÁÁÁÁÁÁÁÁÁÁÁÁÁÁÁÁÁÁÁÁ
ÁÁÁÁÁÁÁÁÁÁÁÁÁÁÁÁÁÁÁÁÁÁÁÁÁÁÁÁÁÁÁÁÁÁÁÁÁÁÁÁÁ
ÁÁÁÁÁÁÁÁÁÁÁÁÁÁÁÁÁÁÁÁÁÁÁÁÁÁÁÁÁÁÁÁÁÁÁÁÁÁÁÁÁ
1
10
High side
600
700
Low side
600
700
1200
1400
TYP
MAX
Total
µA
mΩ
m
ac characteristics, TA = 25°C, VCC = 12 V, RL = 8 Ω (unless otherwise noted)
PARAMETER
kSVR
Supply ripple rejection ratio
PO(max)
Maximum continuous output power
Vn
Output integrated noise floor
SNR
6
TEST CONDITIONS
VCC = 11.5 V to 12.5 V from 10 Hz
to 1 kHz, Gain = 36 dB
MIN
UNITS
−67
dB
3
W
THD+N = 10%, f = 1 kHz, RL = 8 Ω
20 Hz to 22 kHz, No weighting filter,
Gain = 0.5 dB
3.75
W
−82
dBV
Crosstalk, Left → Right
Gain = 13.2 dB, PO = 1 W, RL = 8 Ω
−77
dB
Signal-to-noise ratio
Maximum output at THD+N < 0.5%,
f= 1 kHz, Gain = 0.5 dB
102
dB
Thermal trip point
150
°C
Thermal hystersis
20
°C
THD+N = 1%, f = 1 kHz, RL = 8 Ω
www.ti.com
����������
SLOS406A − FEBRUARY 2003 − REVISED MARCH 2003
Table 1. DC Volume Control
VOLTAGE ON THE
VOLUME PIN AS A
PERCENTAGE OF
VREF (INCREASING
VOLUME OR FIXED
GAIN)
VOLTAGE ON THE
VOLUME PIN AS A
PERCENTAGE OF
VREF (DECREASING
VOLUME)
GAIN OF AMPLIFIER
%
%
dB
0 − 4.5
0 − 2.9
−75†
4.5 − 6.7
2.9 − 5.1
−40.0
6.7 − 8.91
5.1 − 7.2
−37.5
8.9 − 11.1
7.2 − 9.4
−35.0
11.1 − 13.3
9.4 − 11.6
−32.4
13.3 − 15.5
11.6 − 13.8
−29.9
15.5 − 17.7
13.8 − 16.0
−27.4
17.7 − 19.9
16.0 − 18.2
−24.8
19.9 − 22.1
18.2 − 20.4
−22.3
22.1 − 24.3
20.4 − 22.6
−19.8
24.3 − 26.5
22.6 − 24.8
−17.2
26.5 − 28.7
24.8 − 27.0
−14.7
28.7 − 30.9
27.0 − 29.1
−12.2
30.9 − 33.1
29.1 − 31.3
−9.6
33.1 − 35.3
31.3 − 33.5
−7.1
35.3 − 37.5
33.5 − 35.7
−4.6
37.5 − 39.7
35.7 − 37.9
39.7 − 41.9
37.9 − 40.1
−2.0
0.5†
41.9 − 44.1
40.1 − 42.3
3.1
44.1 − 46.4
42.3 − 44.5
5.6
46.4 − 48.6
44.5 − 46.7
8.1
48.6 − 50.8
46.7 − 48.9
10.7
50.8 − 53.0
48.9 − 51.0
13.2
53.0 − 55.2
51.0 − 53.2
15.7
55.2 − 57.4
53.2 − 55.4
18.3
57.4 − 59.6
55.4 − 57.6
20.8
59.6 − 61.8
57.6 − 59.8
23.3
61.8 − 64.0
59.8 − 62.0
25.9
64.0 − 66.2
62.0 − 64.2
28.4
66.2 − 68.4
64.2 − 66.4
30.9
68.4 − 70.6
66.4 − 68.6
33.5
36.0†
> 70.6
>68.6
† Tested in production. Remaining steps are specified by design.
www.ti.com
7
����������
SLOS406A − FEBRUARY 2003 − REVISED MARCH 2003
TYPICAL CHARACTERISTICS
Table of Graphs
FIGURE
PO
Efficiency
vs Output power
1
Output power
vs Load resistance
2
vs Supply voltage
3
IQ
ICC
Quiescent supply current
vs Supply voltage
4
Supply current
vs Output Power
5
IQ(sd)
Quiescent shutdown supply current
vs Supply voltage
6
Input impedance
vs Gain
vs Frequency
THD+N
Total harmonic distortion + noise
kSVR
Supply ripple rejection ratio
vs Output power
vs Frequency
Closed loop response
10, 11
12
13, 14
Intermodulation performance
15
Input offset voltage
vs Common-mode input voltage
16
Crosstalk
vs Frequency
17
Mute attenuation
Shutdown attenuation
Common-mode rejection ratio
8
7
8, 9
18
vs Frequency
vs Frequency
www.ti.com
19
20
����������
SLOS406A − FEBRUARY 2003 − REVISED MARCH 2003
TYPICAL CHARACTERISTICS
EFFICIENCY
vs
OUTPUT POWER
OUTPUT POWER
vs
LOAD RESISTANCE
80
8
70
7
VCC = 12 V, RL = 8 Ω
60
PO − Output Power − W
6
Efficiency − %
VCC = 8.5 V, RL = 8 Ω
50
40
LC Filter
Resistive Load
30
20
10
VCC = 12 V,
THD = 10%
5
Thermally Limited
4
3
2
VCC = 8.5 V,
THD = 10%
1
0
0
0.5
1
1.5
2
PO − Output Power − W
2.5
VCC = 8.5 V,
THD = 1%
0
3
8
9
Figure 1
10
11
12
13
14
RL − Load Resistance − Ω
15
16
Figure 2
OUTPUT POWER
vs
SUPPLY VOLTAGE
QUIESCENT SUPPLY CURRENT
vs
SUPPLY VOLTAGE
6
I Q − Quiescent Supply Current − mA
18
5
PO − Output Power − W
VCC = 12 V,
THD = 1%
Thermally Limited
4
8 Ω, THD = 10%
8 Ω, THD = 1%
3
2
TA = 25°C
17
16
15
14
13
12
11
1
8.5
9
10
11
12
VDD − Supply Voltage − V
13
14
10
8.5
9
10
11
12
VCC − Supply Voltage − V
13
14
Figure 4
Figure 3
www.ti.com
9
����������
SLOS406A − FEBRUARY 2003 − REVISED MARCH 2003
TYPICAL CHARACTERISTICS
SUPPLY CURRENT
vs
OUTPUT POWER (TOTAL)
QUIESCENT SHUTDOWN SUPPLY CURRENT
vs
SUPPLY VOLTAGE
0.8
0.5
0.4
0.3
0.2
0
0.8
0.6
VSD = 0.8 V
0.4
0.2
VSD = 0 V
CC
0.1
1
0
1
2
3
4
5
PO − Output Power (Total) − W
6
I
− Supply Current − A
0.6
I
CC
− Quiescent Shutdown Supply Current − µ A
VCC = 12 V,
RL = 8 Ω
0.7
0
8.5
9
10
11
12
13
VCC − Supply Voltage − V
Figure 5
Figure 6
INPUT IMPEDANCE
vs
GAIN
TOTAL HARMONIC DISTORTION + NOISE
vs
FREQUENCY
120
THD+N − Total Harmonic Distortion + Noise − %
10
Z i − Input Impedance − k Ω
100
80
60
40
20
0
−50
−30
−10
10
Gain − dB
30
50
VCC = 12 V,
RL = 8 Ω,
TA = 25°C
5
2
1
0.5
PO = 1 W
0.2
0.1
0.05
0.02
0.01
20
50
100 200
500
Figure 8
www.ti.com
PO = 0.5 W
PO = 3 W
1k 2k
f − Frequency − Hz
Figure 7
10
14
5 k 10 k 20 k
����������
SLOS406A − FEBRUARY 2003 − REVISED MARCH 2003
TYPICAL CHARACTERISTICS
TOTAL HARMONIC DISTORTION + NOISE
vs
OUTPUT POWER
TOTAL HARMONIC DISTORTION + NOISE
vs
FREQUENCY
10
THD+N − Total Harmonic Distortion + Noise − %
THD+N − Total Harmonic Distortion + Noise − %
10
VCC = 12 V,
RL = 8 Ω,
TA = 25°C
5
2
1
PO = 1 W
0.5
PO = 0.5 W
0.2
0.1
0.05
PO = 3.5 W
0.02
0.01
20
50
100 200 500 1 k 2 k
f − Frequency − Hz
VCC = 8.5 V,
RL = 8 Ω,
TA = 25°C
5
2
1
0.5
f = 1 kHz
f = 20 Hz
0.2
0.1
0.05
f = 20 KHz
0.02
0.01
5 k 10 k 20 k
20m
50m 100m 200m 500m 1
2
PO − Output Power − W
5
10
Figure 10
Figure 9
TOTAL HARMONIC DISTORTION + NOISE
vs
OUTPUT POWER
SUPPLY RIPPLE REJECTION RATIO
vs
FREQUENCY
5
−40
VCC = 12 V,
RL = 8 Ω,
TA = 25°C
k SVR − Supply Ripple Rejection Ratio − dB
THD+N − Total Harmonic Distortion + Noise − %
10
2
1
f = 1 kHz
0.5
f = 20 Hz
0.2
0.1
0.05
f = 20 kHz
0.02
0.01
20m
50m 100m 200m 500m 1
2
5
10
PO − Output Power − W
−45
VCC = 12 V,
RL = 8 Ω
−50
−55
−60
−65
−70
−75
−80
−85
−90
20
100
1k
10 k
100 k
f − Frequency − Hz
Figure 12
Figure 11
www.ti.com
11
����������
SLOS406A − FEBRUARY 2003 − REVISED MARCH 2003
TYPICAL CHARACTERISTICS
CLOSED LOOP RESPONSE
CLOSED LOOP RESPONSE
100
50
Gain
0
Gain
50
0
Phase
50
0
−50
0
−50
−100
−100
Phase − Deg
Gain − dB
Gain − dB
100
Phase
−50
−50
−100
−100
−150
−150
−150
−200
VCC = 12 V,
Gain = +5.6 dB,
RL = 8 Ω
−250
10
100
−200
1k
10 k
100 k
−150
VCC = 12 V,
Gain = +36 dB,
RL = 8 Ω
−200
−250
10
−250
1M
100
Figure 13
INPUT OFFSET VOLTAGE
vs
COMMON-MODE INPUT VOLTAGE
INTERMODULATION PERFORMANCE
6
5
VIO − Input Offset Voltage − mV
FFT − dBr
VCC = 12 V
VCC = 12 V, 19 kHz, 20 kHz,
1:1, PO = 1 W, RL = 8 Ω
Gain= +13.2 dB,
BW =20 Hz to 22 kHz,
Class-D
No Filter
−60
−80
−100
−120
−140
50
4
3
2
1
0
−1
100
1k
f − Frequency − Hz
1
10 k
1.5
2
2.5
3
3.5
4
4.5
VICM − Common-Mode Input Voltage − V
Figure 16
Figure 15
12
−250
1M
100 k
Figure 14
0
−40
−200
1k
10 k
f − Frequency − Hz
f − Frequency − Hz
−20
Phase − Deg
50
www.ti.com
5
����������
SLOS406A − FEBRUARY 2003 − REVISED MARCH 2003
TYPICAL CHARACTERISTICS
CROSSTALK
vs
FREQUENCY
MUTE ATTENUATION
vs
FREQUENCY
−30
−60
−50
−70
Crosstalk − dB
VCC = 12 V,
RL = 8 Ω,
VI = 1 Vrms
Class-D,
VOLUME = 0 V
−40
Mute Attenuation − dB
−65
VCC = 12 V,
Gain = +13.2 dB,
RL = 8 Ω,
PO = 1 W
−75
−80
−85
−60
−70
−80
−90
−100
−110
−90
−95
10
−120
−130
100
1k
10 k
f − Frequency − Hz
10
100 k
100
Figure 17
10 k
Figure 18
COMMON-MODE REJECTION RATIO
vs
FREQUENCY
SHUTDOWN ATTENUATION
vs
FREQUENCY
−60
−80
−90
CMRR − Common-Mode Rejection Ratio − dB
VCC = 12 V,
RL = 8 Ω,
VI = 1 Vrms
Gain = +13.2 dB,
Class-D
−85
Shutdown Attenuation − dB
1k
f − Frequency − Hz
−95
−100
−105
−110
−115
−120
−125
100
1k
−70
−80
−90
−100
20
−130
10
VCC = 12 V
10 k
100
1k
10 k 20 k
f − Frequency − Hz
f − Frequency − Hz
Figure 20
Figure 19
www.ti.com
13
����������
SLOS406A − FEBRUARY 2003 − REVISED MARCH 2003
VCC
ROUT+
GND
VCC
ROUT−
APPLICATION INFORMATION
C23
1 nF
C22
1 nF
L1
(Bead)
L2
(Bead)
10 µF
PGND
10 nF
10 nF
C15
0.1uF
0.1uF
C9
C10
1 µF
1 µF
P1
50 kΩ
BSRP
PVCCR
ROUTP
ROUTP
PGNDR
ROUTN
PGNDR
ROUTN
PVCCR
NC
RINP
MUTE
V2P5
AVCC
LINP
NC
LINN
NC
TPA3003D2
AVDDREF
GND
AVDD
AGND
COSC
AGND
ROSC
VOLUME
AGND
REFGND
VCLAMPL
PGND
1 µF
C13
0.1 µF
FADE
VREF
C11
220pF
100 nF
R1
120 kΩ
AGND
BSLP
PVCCL
PVCCL
PGND
L3
(Bead)
L4
(Bead)
C25
1nF
GND
C24
1nF
VCC
LOUTP
10 nF
10 µF
LOUT−
PGND
VCC
10 nF
GND
1 µF
C21
0.1 µF
Figure 21. Stereo Configuration With Single-Ended Inputs
www.ti.com
MUTE
CONTROL
VCC
AVDD
C14
C6
C12
0.1 µF
C17
LOUT+
C20
LOUTP
PGNDL
PGNDL
LOUTN
AGND
14
C16
10 µF
C8
GND
LOUTN
LIN−
1 µF
1 µF C4
RINN
PVCCL
C3
PVCCR
BSRN
C2
1 µF C5
AGND
C7
VCLAMPR
PVCCL
RIN−
SD
C1
BSLN
SHUTDOWN
PVCCR
C19
C18
����������
SLOS406A − FEBRUARY 2003 − REVISED MARCH 2003
APPLICATION INFORMATION
class-D operation
This section focuses on the class-D operation of the TPA3003D2.
traditional class-D modulation scheme
The traditional class-D modulation scheme, which is used in the TPA032D0x family, has a differential output
where each output is 180 degrees out of phase and changes from ground to the supply voltage, VCC. Therefore,
the differential prefiltered output varies between positive and negative VCC, where filtered 50% duty cycle yields
0 V across the load. The traditional class-D modulation scheme with voltage and current waveforms is shown
in Figure 22. Note that even at an average of 0 V across the load (50% duty cycle), the current to the load is
high, causing high loss, thus causing a high supply current.
OUTP
OUTN
+12 V
Differential Voltage
Across Load
0V
−12 V
Current
Figure 22. Traditional Class-D Modulation Scheme’s Output Voltage and
Current Waveforms Into an Inductive Load With No Input
TPA3003D2 modulation scheme
The TPA3003D2 uses a modulation scheme that still has each output switching from 0 to the supply voltage.
However, OUTP and OUTN are now in phase with each other with no input. The duty cycle of OUTP is greater
than 50% and OUTN is less than 50% for positive output voltages. The duty cycle of OUTP is less than 50%
and OUTN is greater than 50% for negative output voltages. The voltage across the load sits at 0 V throughout
most of the switching period, greatly reducing the switching current, which reduces any I2R losses in the load.
www.ti.com
15
����������
SLOS406A − FEBRUARY 2003 − REVISED MARCH 2003
APPLICATION INFORMATION
TPA3003D2 modulation scheme (continued)
OUTP
OUTN
Differential
Voltage
Across
Load
Output = 0 V
+12 V
0V
−12 V
Current
OUTP
OUTN
Differential
Voltage
Output > 0 V
+12 V
0V
Across
Load
−12 V
Current
Figure 23. The TPA3003D2 Output Voltage and Current Waveforms Into an Inductive Load
efficiency: LC filter required with the traditional class-D modulation scheme
The main reason that the traditional class-D amplifier needs an output filter is that the switching waveform
results in maximum current flow. This causes more loss in the load, which causes lower efficiency. The ripple
current is large for the traditional modulation scheme, because the ripple current is proportional to voltage
multiplied by the time at that voltage. The differential voltage swing is 2 × VCC, and the time at each voltage is
half the period for the traditional modulation scheme. An ideal LC filter is needed to store the ripple current from
each half cycle for the next half cycle, while any resistance causes power dissipation. The speaker is both
resistive and reactive, whereas an LC filter is almost purely reactive.
The TPA3003D2 modulation scheme has very little loss in the load without a filter because the pulses are very
short and the change in voltage is VCC instead of 2 × VCC. As the output power increases, the pulses widen,
making the ripple current larger. Ripple current could be filtered with an LC filter for increased efficiency, but for
most applications the filter is not needed.
An LC filter with a cutoff frequency less than the class-D switching frequency allows the switching current to flow
through the filter instead of the load. The filter has less resistance than the speaker, which results in less power
dissipation, therefore increasing efficiency.
16
www.ti.com
����������
SLOS406A − FEBRUARY 2003 − REVISED MARCH 2003
APPLICATION INFORMATION
effects of applying a square wave into a speaker
Audio specialists have advised for years not to apply a square wave to speakers. If the amplitude of the
waveform is high enough and the frequency of the square wave is within the bandwidth of the speaker, the
square wave could cause the voice coil to jump out of the air gap and/or scar the voice coil. A 250-kHz switching
frequency, however, does not significantly move the voice coil, as the cone movement is proportional to 1/f2 for
frequencies beyond the audio band.
Damage may occur if the voice coil cannot handle the additional heat generated from the high-frequency
switching current. The amount of power dissipated in the speaker may be estimated by first considering the
overall efficiency of the system. If the on-resistance (rds(on)) of the output transistors is considered to cause the
dominant loss in the system, then the maximum theoretical efficiency for the TPA3003D2 with an 8-Ω load is
as follows:
ǒ
Efficiency (theoretical, %) + R ń R ) r
L
L
ds(on)
Ǔ
100% + 8ń(8 ) 1.4)
100% + 85.11%
(1)
The maximum measured output power is approximately 3 W with an 12-V power supply. The total theoretical
power supplied (P(total)) for this worst-case condition would therefore be as follows:
P
(total)
+ P ńEfficiency + 3 W ń 0.8511 + 3.52 W
O
(2)
The efficiency measured in the lab using an 8-Ω speaker was 75%. The power not accounted for as dissipated
across the rds(on) may be calculated by simply subtracting the theoretical power from the measured power:
Other losses + P
(total)
(measured) * P
(total)
(theoretical) + 4 * 3.52 + 0.48 W
(3)
The quiescent supply current at 12 V is measured to be 28.5 mA. It can be assumed that the quiescent current
encapsulates all remaining losses in the device, i.e., biasing and switching losses. It may be assumed that any
remaining power is dissipated in the speaker and is calculated as follows:
P
(dis)
+ 0.48 W * (12 V
28.5 mA) + 0.14 W
(4)
Note that these calculations are for the worst-case condition of 3 W delivered to the speaker. Since the 0.14 W
is only 5% of the power delivered to the speaker, it may be concluded that the amount of power actually
dissipated in the speaker is relatively insignificant. Furthermore, this power dissipated is well within the
specifications of most loudspeaker drivers in a system, as the power rating is typically selected to handle the
power generated from a clipping waveform.
when to use an output filter
Design the TPA3003D2 without the filter if the traces from amplifier to speaker are short (< 1 inch). Powered
speakers, where the speaker is in the same enclosure as the amplifier, is a typical application for class-D without
a filter.
Most applications require a ferrite bead filter. The ferrite filter reduces EMI around 1 MHz and higher (FCC and
CE only test radiated emissions greater than 30 MHz). When selecting a ferrite bead, choose one with high
impedance at high frequencies, but very low impedance at low frequencies.
Use a LC output filter if there are low frequency (


 工商网监
湘ICP备2023018690号
工商网监
湘ICP备2023018690号
