www.ti.com
Table of Contents
User’s Guide
TPS548B22 SWIFT™ Step-Down Converter Evaluation
Module User's Guide
ABSTRACT
This user's guide describes the characteristics, operation, and use of the TPS548B22 Evaluation Module
(EVM). The user's guide includes test information, descriptions, and results. A complete schematic diagram,
printed-circuit board layouts, and bill of materials are also included in this document. Throughout this user's
guide, the abbreviations EVM, TPS548B22EVM, and the term evaluation module are synonymous with the
TPS548B22EVM-847, unless otherwise noted.
Table of Contents
1 Introduction.............................................................................................................................................................................3
1.1 Before You Begin............................................................................................................................................................... 3
2 Description.............................................................................................................................................................................. 4
2.1 Typical End-User Applications........................................................................................................................................... 4
2.2 EVM Features.................................................................................................................................................................... 4
3 EVM Electrical Performance Specifications.........................................................................................................................5
4 Schematic................................................................................................................................................................................6
5 Test Equipment....................................................................................................................................................................... 7
6 PWR-847EVM...........................................................................................................................................................................8
7 List of Test Points, Jumpers, and Switch............................................................................................................................. 9
8 Test Procedure...................................................................................................................................................................... 10
8.1 Line and Load Regulation Measurement Procedure........................................................................................................10
8.2 Efficiency..........................................................................................................................................................................10
8.3 Equipment Shutdown....................................................................................................................................................... 11
9 Performance Data and Typical Characteristic Curves.......................................................................................................11
9.1 Efficiency.......................................................................................................................................................................... 11
9.2 Power Loss.......................................................................................................................................................................11
9.3 Load Regulation............................................................................................................................................................... 12
9.4 Transient Response......................................................................................................................................................... 12
9.5 Output Ripple................................................................................................................................................................... 13
9.6 Control On........................................................................................................................................................................15
9.7 Control On and Off........................................................................................................................................................... 17
9.8 Thermal Image................................................................................................................................................................. 18
10 EVM Assembly Drawing and PCB Layout........................................................................................................................ 19
11 List of Materials...................................................................................................................................................................24
12 Revision History................................................................................................................................................................. 26
List of Figures
Figure 4-1. PWR-847EVM Schematic......................................................................................................................................... 6
Figure 6-1. PWR-847EVM Overview........................................................................................................................................... 8
Figure 6-2. Tip and Barrel Measurement..................................................................................................................................... 8
Figure 9-1. Efficiency of 1-V Output vs Load............................................................................................................................. 11
Figure 9-2. Power Loss of 1-V Output vs Load.......................................................................................................................... 11
Figure 9-3. Load Regulation of 1-V Output................................................................................................................................12
Figure 9-4. Transient Response of 1-V Output at 12 VIN, Transient is 0.5 A to 15.5 A, the Step is 15 A at 40 A/µs................. 12
Figure 9-5. Output Ripple and SW Node of 1-V Output at 12 VIN, 25-A Output........................................................................ 13
Figure 9-6. Output Ripple and SW Node of 1-V Output at 12 VIN, 0-A Output.......................................................................... 14
Figure 9-7. Start up from Control, 1-V Output at 12 VIN, 0-A Output......................................................................................... 15
Figure 9-8. 0.5-V Pre-bias start up from Control, 1-V Output at 12 VIN, 10-A Output................................................................16
SLUUBI9A – NOVEMBER 2016 – REVISED AUGUST 2021
TPS548B22 SWIFT™ Step-Down Converter Evaluation Module User's Guide
Submit Document Feedback
Copyright © 2021 Texas Instruments Incorporated
1
�Trademarks
www.ti.com
Figure 9-9. Output Voltage Start-up and Shutdown, 1-V Output at 1 2VIN, 0.5-A Output.......................................................... 17
Figure 9-10. Thermal Image at 1-V Output at 12 VIN, 25-A Output, at 25°C Ambient............................................................... 18
Figure 10-1. PWR-847EVM Top Layer Assembly Drawing (Top View)......................................................................................19
Figure 10-2. PWR-847EVM Top Solder Mask (Top View)......................................................................................................... 19
Figure 10-3. PWR-847EVM Top Layer (Top View).................................................................................................................... 20
Figure 10-4. PWR-847EVM Inner Layer 1 (Top View)............................................................................................................... 20
Figure 10-5. PWR-847EVM Inner Layer 2 (Top View)............................................................................................................... 21
Figure 10-6. PWR-847EVM Inner Layer 3 (Top View)............................................................................................................... 21
Figure 10-7. PWR-847EVM Inner Layer 4 (Top View)............................................................................................................... 22
Figure 10-8. PWR-847EVM Bottom Layer (Top View)...............................................................................................................22
Figure 10-9. PWR-847EVM Bottom Solder Mask (Top View)....................................................................................................23
Figure 10-10. PWR-847EVM Bottom Overlay Layer (Top View)............................................................................................... 23
List of Tables
Table 3-1. PWR-847EVM Electrical Performance Specifications................................................................................................ 5
Table 7-1. Test Point Functions....................................................................................................................................................9
Table 8-1. List of Test Points for Line and Load Measurements................................................................................................ 10
Table 8-2. List of Test Points for Efficiency Measurements........................................................................................................10
Table 11-1. PWR847 List of Materials........................................................................................................................................24
Trademarks
All trademarks are the property of their respective owners.
2
TPS548B22 SWIFT™ Step-Down Converter Evaluation Module User's Guide
SLUUBI9A – NOVEMBER 2016 – REVISED AUGUST 2021
Submit Document Feedback
Copyright © 2021 Texas Instruments Incorporated
�www.ti.com
Introduction
1 Introduction
The PWR847EVM evaluation module uses the TPS548B22 device. The TPS548B22 is a highly integrated
synchronous buck converter that is designed for up to 25-A current output.
1.1 Before You Begin
The following warnings and cautions are noted for the safety of anyone using or working close to the
TPS548B22EVM-847. Observe all safety precautions.
Warning
The TPS548B22EVM-847 circuit module may become hot during operation due
to dissipation of heat. Avoid contact with the board. Follow all applicable safety
procedures applicable to your laboratory.
Caution
Do not leave the EVM powered when unattended.
!
WARNING
The circuit module has signal traces, components, and component leads on the bottom of the board.
This may result in exposed voltages, hot surfaces or sharp edges. Do not reach under the board
during operation.
CAUTION
The circuit module may be damaged by over temperature. To avoid damage, monitor the
temperature during evaluation and provide cooling, as needed, for your system environment.
CAUTION
Some power supplies can be damaged by application of external voltages. If using more than
1 power supply, check your equipment requirements and use blocking diodes or other isolation
techniques, as needed, to prevent damage to your equipment.
CAUTION
The communication interface is not isolated on the EVM. Be sure no ground potential exists between
the computer and the EVM. Also be aware that the computer is referenced to the Battery- potential
of the EVM.
SLUUBI9A – NOVEMBER 2016 – REVISED AUGUST 2021
TPS548B22 SWIFT™ Step-Down Converter Evaluation Module User's Guide
Submit Document Feedback
Copyright © 2021 Texas Instruments Incorporated
3
�Description
www.ti.com
2 Description
The PWR847EVM is designed as a single output DC-DC converter that demonstrates the TPS548B22 in a
typical low-voltage application while providing a number of test points to evaluate the performance. It uses a
nominal 12-V input bus to produce a regulated 1-V output at up to 25-A load current.
2.1 Typical End-User Applications
•
•
•
•
•
Enterprise storage, SSD, NAS
Wireless and wired communication infrastructure
Industrial PCs, automation, ATE, PLC, video surveillance
Enterprise server, switches, routers
ASIC, SoC, FPGA, DSP core and I/O rails
2.2 EVM Features
•
•
4
Regulated 1-V output up to 25-A, steady-state output current
Convenient test points for probing critical waveforms
TPS548B22 SWIFT™ Step-Down Converter Evaluation Module User's Guide
SLUUBI9A – NOVEMBER 2016 – REVISED AUGUST 2021
Submit Document Feedback
Copyright © 2021 Texas Instruments Incorporated
�www.ti.com
EVM Electrical Performance Specifications
3 EVM Electrical Performance Specifications
Table 3-1. PWR-847EVM Electrical Performance Specifications
Parameter
Test Conditions
Min
Typ
Max
5
12
14
Units
Input Characteristics
Voltage range
VIN tied to VDD
Maximum input current
VIN = 12 V, IO = 25 A
No load input current
VIN = 12 V, IO = 0 A
12
V
A
60
mA
1
V
Output Characteristics
VOUT
Output voltage
Output current = 10 A
IOUT
Output load current
IOUT(min) to IOUT(max)
Output voltage regulation
VOUT
Output voltage ripple
VOUT
Output overcurrent
0
25
Line regulation: input voltage = 5 V to 14 V
0.5%
Load regulation: output current = 0 A to IOUT(max)
0.5%
VIN = 12 V, IOUT = 25 A
A
10
mVPP
32
A
650
kHz
Systems Characteristics
VOUT
Switching frequency
FSW
Peak efficiency
VIN = 12 V, IO = 12 A, FSW = 650 kHz
Operating temperature
Toper
90%
0
85
°C
SLUUBI9A – NOVEMBER 2016 – REVISED AUGUST 2021
TPS548B22 SWIFT™ Step-Down Converter Evaluation Module User's Guide
Submit Document Feedback
Copyright © 2021 Texas Instruments Incorporated
5
�Schematic
www.ti.com
4 Schematic
J1
VIN = 6V - 16V
C1
DNP 330uF
C11
100µF
C2
22µF
C3
22µF
C12
DNP
330uF
C13
22µF
C4
22µF
C5
22µF
DNPC14
22uF
DNPC15
22uF
TP5
SW
L1
C6
22µF
DNPC16
22uF
C7
22µF
DNPC17
22uF
C8
22µF
DNPC18
22uF
C9
22µF
DNPC19
22uF
C10
2200pF
DNPC20
22µF
J2
PGND
VDD
TP1
R1
1.00
U1
VDD
DNP
R6
200k
C35
1µF TP4
C34
1uF
VDD
21
22
23
24
25
PVIN
PVIN
PVIN
PVIN
PVIN
DRGND
TP9
BP
4
CNTL
CNTL/EN_UVLO
BP
J4
LOW
28
R12
100k
31
C45
4.7µF
DNP C44
1uF
R13
PGOOD
TP8
100k
MODE
FSEL
DRGND
DRGND
TP12
ILIM
VSEL
PGOOD
34
MODE
33
36
TP14
R19
61.9k
37
DNP C46
1000pF
ALERT
DATA
1
2
3
CLK
29
AGND
30
TP2
R2
DNP
0
0
8
9
10
11
12
SW
SW
SW
SW
SW
EN_UVLO
BP
NetC31_1
5 R10
BOOT
35
32
40
VOSNS
NC
NC
NC
NC
6
7
26
27
RSP
39
C22
0.1µF
330nH
TP6
DNPC21
R5
DNP
470pF
1.50k
TP19
R9
DNP
3.01
DNP
PGND
C36
1000pF
FSEL
TP7
R11
0
R8 DNPC32
1.10k 6800pF
CHA
C31
DNP
0.1uF
R15
10.0k
C25
100µF
C26
100µF
DNPC27
100µF
DNPC28
100µF
C29
100µF
DNPC30
100uF
C23
DNP470µF
C24
470µF
C39
100µF
C40
100µF
DNPC41
100µF
C42
100µF
DNPC43
100uF
C37
DNP470uF
C38
470µF
R16
38
RSN
J5
0
ILIM
RESV_TRK
NU
NU
NU
DRGND
AGND
TP10
13
14
15
16
17
18
19
20
PGND
PGND
PGND
PGND
PGND
PGND
PGND
PGND
VOUT = 1V
I_OUT = 25A MAX
C33
100µF
R14
DNP
0
NetC31_1
VSEL
J3
R3
DNP
0
R4
0
CHB
R7
0
TP3
Remote Sense pos/neg should run as balanced pair
TP13
TP18
PGND
PGND
NT1
NT2
Net-Tie
Net-Tie
R17
DNP
0
TP11
R18
DNP
0
PGND
41
PAD
TPS548B22RVFR
DRGND
AGND
PGND
AGND
PGND
DRGND
----- GND NET TIES ----TP15
VSEL
TP16
MODE
TP17
FSEL
R20
100k
VSEL
R21
100k
MODE
R22
100k
J6
1
3
5
7
9
DNP
2
4
6
8
10
DATA
ALERT
CLK
BP
TP20
CLK DNP
TP21
DATADNP
TP22
DNP
ALERT
FSEL
PMBus
R23
37.4k
R24
42.2k
R25
25.5k
AGND
Copyright © 2016, Texas Instruments Incorporated
AGND
Figure 4-1. PWR-847EVM Schematic
6
TPS548B22 SWIFT™ Step-Down Converter Evaluation Module User's Guide
Copyright © 2021 Texas Instruments Incorporated
SLUUBI9A – NOVEMBER 2016 – REVISED AUGUST 2021
Submit Document Feedback
�www.ti.com
Test Equipment
5 Test Equipment
Voltage Source: The input voltage source VIN must be a 0-V to 18-V variable DC source capable of supplying
at least 12 ADC. Also, the output impedance of the external voltage source must be much less than 100 kΩ.
Multimeters: It is recommended to use two separate multimeters Figure 6-1. One meter is used to measure VIN
and one to measure VOUT.
Output Load: A variable electronic load is recommended for testing Figure 6-1. It must be capable of 25 A at
voltages as low as 0.6 V.
Oscilloscope: An oscilloscope is recommended for measuring output noise and ripple. Output ripple must
be measured using a tip-and-barrel method or better as shown in Figure 6-2.The scope must be adjusted to
20-MHz bandwidth, AC coupling at 50 mV/division, and must be set to 1-µs/division.
Fan: During prolonged operation at high loads, it may be necessary to provide forced air cooling with a small fan
aimed at the EVM. Temperature of the devices on the EVM must be maintained below 105°C.
Recommended Wire Gauge: The voltage drop in the load wires must be kept as low as possible in order to
keep the working voltage at the load within its operating range. Use the AWG 14 wire (2 wires parallel for VOUT
positive and 2 wires parallel for the VOUT negative) of no more than 1.98 feet between the EVM and the load.
This recommended wire gauge and length should achieve a voltage drop of no more than 0.2 V at the maximum
25-A load.
SLUUBI9A – NOVEMBER 2016 – REVISED AUGUST 2021
TPS548B22 SWIFT™ Step-Down Converter Evaluation Module User's Guide
Submit Document Feedback
Copyright © 2021 Texas Instruments Incorporated
7
�PWR-847EVM
www.ti.com
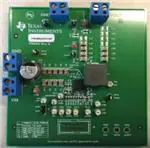
6 PWR-847EVM
Figure 6-1. PWR-847EVM Overview
Spacer
Metal Ground
Barrel
Probe
Tip
Figure 6-2. Tip and Barrel Measurement
8
TPS548B22 SWIFT™ Step-Down Converter Evaluation Module User's Guide
SLUUBI9A – NOVEMBER 2016 – REVISED AUGUST 2021
Submit Document Feedback
Copyright © 2021 Texas Instruments Incorporated
�www.ti.com
List of Test Points, Jumpers, and Switch
7 List of Test Points, Jumpers, and Switch
Table 7-1. Test Point Functions
Item
Type
Name
Description
TP5
T-H loop
SW
TP7
T-H loop
CH-A
Measure loop stability
TP6
T-H loop
CH-B
Measure loop stability
TP2
T-H loop
LocS+
Sense VOUT + locally across C5. Use for efficiency and ripple measurements
TP10
T-H loop
LocS-
Sense VOUT– locally across C5. Use for efficiency and ripple measurements
TP3
T-H loop
RemS+
Remote sense +
TP11
T-H loop
RemS-
Remote sense –
TP4
T-H loop
PVIN
Sense VIN + across C10
TP13
T-H loop
PGND
Sense VIN – across C10
TP1
T-H loop
VDD
Supplies the internal circuitry
TP17
T-H loop
FSEL
Monitor the FSEL external resistor divider ratio during initial power up.
TP15
T-H loop
VSEL
Monitor the VSEL external resistor divider ratio during initial power up.
TP9
T-H loop
BP
LDO output
TP8
T-H loop
PG
Power good
TP16
T-H loop
MODE
TP12
T-H loop
ILIM
TP14
T-H loop
RESV_TRK
Do not connect.
TP19
T-H loop
PGND
Common GND
TP18
T-H loop
PGND
Common GND
TP20
T-H loop
CLK
Not used
TP21
T-H loop
DATA
Not used
TP22
T-H loop
ALERT
Not used
JP4
2-pin jumper
CNTL
Shunts control pin to GND
Power supply Switch node
Monitor the MODE external resistor divider ratio during initial power up.
Program over-current limit.
SLUUBI9A – NOVEMBER 2016 – REVISED AUGUST 2021
TPS548B22 SWIFT™ Step-Down Converter Evaluation Module User's Guide
Submit Document Feedback
Copyright © 2021 Texas Instruments Incorporated
9
�Test Procedure
www.ti.com
8 Test Procedure
8.1 Line and Load Regulation Measurement Procedure
1.
2.
3.
4.
5.
6.
7.
Connect VOUT to J3 and VOUT_GND to J5 Figure 6-1.
Ensure that the electronic load is set to draw 0 ADC.
Ensure the jumper provided on the EVM shorts on J4 before VIN is applied
Connect VIN to J1 and VIN_GND to J2 Figure 6-1.
Increase VIN from 0 V to 12 V using the digital multimeter to measure input voltage.
Remove the jumper on J4 to enable the controller.
Use the other digital multimeter or the oscilloscope to measure output voltage VOUT at TP2 and TP10.
Table 8-1. List of Test Points for Line and Load Measurements
Test Point
Node Name
Description
TP2
LocS+
Sense VOUT + locally across C5. Use for efficiency and ripple measurements
TP10
LocS-
Sense VOUT - locally across C5. Use for efficiency and ripple measurements
TP4
PVIN
Sense VIN + across C10
TP13
PGND
Sense VIN - across C10
8. Vary the load from 0 ADC to maximum rated output 25 ADC. VOUT must remain in regulation as defined in
Table 3-1.
9. Vary VIN from 5 V to 14 V. VOUT must remain in regulation as defined in Table 3-1.
10. Decrease the load to 0 A.
11. Put the jumper back on J4 to disable the converter.
12. Decrease VIN to 0 V or turn off the supply.
8.2 Efficiency
To measure the efficiency of the power train on the EVM, it is important to measure the voltages at the correct
location. This is necessary because otherwise the measurements will include losses in efficiency that are not
related to the power train itself. Losses incurred by the voltage drop in the copper traces and in the input and
output connectors are not related to the efficiency of the power train, and they must not be included in efficiency
measurements.
Table 8-2. List of Test Points for Efficiency Measurements
Test Point
Node Name
TP2
LocS+
Sense VOUT + locally across C25. Use for efficiency and ripple measurements
Description
TP10
LocS-
Sense VOUT - locally across C25. Use for efficiency and ripple measurements
TP4
PVIN
Sense VIN + across C10
TP13
PGND
Sense VIN - across C10
Input current can be measured at any point in the input wires, and output current can be measured anywhere
in the output wires of the output being measured. Using these measurement points result in efficiency
measurements that do not include losses due to the connectors and PCB traces.
10
TPS548B22 SWIFT™ Step-Down Converter Evaluation Module User's Guide
SLUUBI9A – NOVEMBER 2016 – REVISED AUGUST 2021
Submit Document Feedback
Copyright © 2021 Texas Instruments Incorporated
�www.ti.com
Test Procedure
8.3 Equipment Shutdown
1.
2.
3.
4.
Reduce the load current to 0 A.
Reduce input voltage to 0 V.
Shut down the external fan if in use.
Shut down equipment.
9 Performance Data and Typical Characteristic Curves
Figure 9-1 through Figure 9-10 present typical performance curves for the PWR-847EVM.
SPACE
9.1 Efficiency
100
95
90
Efficiency (%)
85
80
75
Vin = 5V
70
Vin = 12V
65
Vin = 14V
Vin = 18V
60
0
5
10
15
20
25
Load Current (A)
Figure 9-1. Efficiency of 1-V Output vs Load
9.2 Power Loss
4.5
4.0
Converter Power Loss (W)
3.5
3.0
2.5
2.0
1.5
Vin = 5V
1.0
Vin = 12V
Vin = 14V
0.5
Vin = 18V
0.0
0
5
10
15
20
25
Load Current (A)
Figure 9-2. Power Loss of 1-V Output vs Load
SLUUBI9A – NOVEMBER 2016 – REVISED AUGUST 2021
TPS548B22 SWIFT™ Step-Down Converter Evaluation Module User's Guide
Submit Document Feedback
Copyright © 2021 Texas Instruments Incorporated
11
�Performance Data and Typical Characteristic Curves
www.ti.com
9.3 Load Regulation
Output Voltage Regulation (V)
1.010
1.005
1.000
Vin = 5V
0.995
Vin = 12V
Vin = 14V
Vin = 18V
0.990
0
5
10
15
20
25
Load Current (A)
Figure 9-3. Load Regulation of 1-V Output
9.4 Transient Response
Figure 9-4. Transient Response of 1-V Output at 12 VIN, Transient is 0.5 A to 15.5 A, the Step is 15 A at 40
A/µs
12
TPS548B22 SWIFT™ Step-Down Converter Evaluation Module User's Guide
SLUUBI9A – NOVEMBER 2016 – REVISED AUGUST 2021
Submit Document Feedback
Copyright © 2021 Texas Instruments Incorporated
�www.ti.com
Performance Data and Typical Characteristic Curves
9.5 Output Ripple
Figure 9-5. Output Ripple and SW Node of 1-V Output at 12 VIN, 25-A Output
SLUUBI9A – NOVEMBER 2016 – REVISED AUGUST 2021
TPS548B22 SWIFT™ Step-Down Converter Evaluation Module User's Guide
Submit Document Feedback
Copyright © 2021 Texas Instruments Incorporated
13
�Performance Data and Typical Characteristic Curves
www.ti.com
Figure 9-6. Output Ripple and SW Node of 1-V Output at 12 VIN, 0-A Output
14
TPS548B22 SWIFT™ Step-Down Converter Evaluation Module User's Guide
SLUUBI9A – NOVEMBER 2016 – REVISED AUGUST 2021
Submit Document Feedback
Copyright © 2021 Texas Instruments Incorporated
�www.ti.com
Performance Data and Typical Characteristic Curves
9.6 Control On
Figure 9-7. Start up from Control, 1-V Output at 12 VIN, 0-A Output
SLUUBI9A – NOVEMBER 2016 – REVISED AUGUST 2021
TPS548B22 SWIFT™ Step-Down Converter Evaluation Module User's Guide
Submit Document Feedback
Copyright © 2021 Texas Instruments Incorporated
15
�Performance Data and Typical Characteristic Curves
www.ti.com
Figure 9-8. 0.5-V Pre-bias start up from Control, 1-V Output at 12 VIN, 10-A Output
16
TPS548B22 SWIFT™ Step-Down Converter Evaluation Module User's Guide
SLUUBI9A – NOVEMBER 2016 – REVISED AUGUST 2021
Submit Document Feedback
Copyright © 2021 Texas Instruments Incorporated
�www.ti.com
Performance Data and Typical Characteristic Curves
9.7 Control On and Off
Figure 9-9. Output Voltage Start-up and Shutdown, 1-V Output at 1 2VIN, 0.5-A Output
SLUUBI9A – NOVEMBER 2016 – REVISED AUGUST 2021
TPS548B22 SWIFT™ Step-Down Converter Evaluation Module User's Guide
Submit Document Feedback
Copyright © 2021 Texas Instruments Incorporated
17
�Performance Data and Typical Characteristic Curves
www.ti.com
9.8 Thermal Image
Figure 9-10. Thermal Image at 1-V Output at 12 VIN, 25-A Output, at 25°C Ambient
18
TPS548B22 SWIFT™ Step-Down Converter Evaluation Module User's Guide
SLUUBI9A – NOVEMBER 2016 – REVISED AUGUST 2021
Submit Document Feedback
Copyright © 2021 Texas Instruments Incorporated
�www.ti.com
EVM Assembly Drawing and PCB Layout
10 EVM Assembly Drawing and PCB Layout
Figure 10-1 through Figure 10-8 show the design of the PWR-847EVM printed-circuit board (PCB). The
PWR-847EVM has a 2-oz. copper finish for all layers.
Spacer
Figure 10-1. PWR-847EVM Top Layer Assembly Drawing (Top View)
Figure 10-2. PWR-847EVM Top Solder Mask (Top View)
SLUUBI9A – NOVEMBER 2016 – REVISED AUGUST 2021
TPS548B22 SWIFT™ Step-Down Converter Evaluation Module User's Guide
Submit Document Feedback
Copyright © 2021 Texas Instruments Incorporated
19
�EVM Assembly Drawing and PCB Layout
www.ti.com
Figure 10-3. PWR-847EVM Top Layer (Top View)
Figure 10-4. PWR-847EVM Inner Layer 1 (Top View)
20
TPS548B22 SWIFT™ Step-Down Converter Evaluation Module User's Guide
SLUUBI9A – NOVEMBER 2016 – REVISED AUGUST 2021
Submit Document Feedback
Copyright © 2021 Texas Instruments Incorporated
�www.ti.com
EVM Assembly Drawing and PCB Layout
Figure 10-5. PWR-847EVM Inner Layer 2 (Top View)
Figure 10-6. PWR-847EVM Inner Layer 3 (Top View)
SLUUBI9A – NOVEMBER 2016 – REVISED AUGUST 2021
TPS548B22 SWIFT™ Step-Down Converter Evaluation Module User's Guide
Submit Document Feedback
Copyright © 2021 Texas Instruments Incorporated
21
�EVM Assembly Drawing and PCB Layout
www.ti.com
Figure 10-7. PWR-847EVM Inner Layer 4 (Top View)
Figure 10-8. PWR-847EVM Bottom Layer (Top View)
22
TPS548B22 SWIFT™ Step-Down Converter Evaluation Module User's Guide
SLUUBI9A – NOVEMBER 2016 – REVISED AUGUST 2021
Submit Document Feedback
Copyright © 2021 Texas Instruments Incorporated
�www.ti.com
EVM Assembly Drawing and PCB Layout
Figure 10-9. PWR-847EVM Bottom Solder Mask (Top View)
Figure 10-10. PWR-847EVM Bottom Overlay Layer (Top View)
SLUUBI9A – NOVEMBER 2016 – REVISED AUGUST 2021
TPS548B22 SWIFT™ Step-Down Converter Evaluation Module User's Guide
Submit Document Feedback
Copyright © 2021 Texas Instruments Incorporated
23
�List of Materials
www.ti.com
11 List of Materials
The EVM components list, according to the schematic, is shown in Table 11-1.
Table 11-1. PWR847 List of Materials
Item#
Manufacturer
Description
Package Reference
2
C2, C3, C4, C5, C6, C7, C8,
C9, C13
9
22uF
GRM32ER71E226KE15L
MuRata
CAP, CERM, 22 µF, 25 V, +/- 10%, X7R, 1210
1210
3
C10
1
2200pF
GRM155R61E222KA01D
MuRata
CAP, CERM, 2200 pF, 25 V, +/- 10%, X5R, 0402
0402
4
C11
1
100uF
EEE-FC1V101P
Panasonic
CAP, AL, 100uF, 35V, +/-20%, 0.15 ohm, SMD
SMT Radial G
5
C22
1
0.1uF
GRM188R71H104KA93D
MuRata
CAP, CERM, 0.1 µF, 50 V, +/- 10%, X7R, 0603
0603
6
C24, C38
2
470uF
2R5TPF470M6L
Panasonic
CAP, Tantalum Polymer, 470 µF, 2.5 V, +/- 20%,
0.006 ohm, 7.3x2.8x4.3mm SMD
7.3x2.8x4.3mm
7
C25, C26, C29, C33, C39,
C40, C42
7
100uF
GRM32ER60J107ME20L
MuRata
CAP, CERM, 100 µF, 6.3 V, +/- 20%, X5R, 1210
1210
8
C35
1
1uF
C0603C105K4PACTU
Kemet
CAP, CERM, 1 µF, 16 V, +/- 10%, X5R, 0603
0603
9
C45
1
4.7uF
GRM21BR71C475KA73L
MuRata
CAP, CERM, 4.7 µF, 16 V, +/- 10%, X7R, 0805
0805
10
H9, H10, H11, H12
4
SJ-5303 (CLEAR)
3M
Bumpon, Hemisphere, 0.44 X 0.20, Clear
Transparent Bumpon
11
J1, J2, J3, J5
4
ED120/2DS
On-Shore Technology
TERMINAL BLOCK 5.08MM VERT 2POS, TH
TERM_BLK, 2pos, 5.08mm
12
J4
1
PEC02SAAN
Sullins Connector Solutions
Header, 100mil, 2x1, Tin, TH
Header, 2 PIN, 100mil, Tin
13
L1
1
744309033
Wurth Elektronik
Inductor, Shielded Drum Core, Ferrite, 330 nH, 50
A, 0.000165 ohm, SMD
12.5x13mm
14
LBL1
1
THT-14-423-10
Brady
Thermal Transfer Printable Labels, 0.650" W x
0.200" H - 10,000 per roll
PCB Label 0.650"H x 0.200"W
15
R1
1
1.00
RC0603FR-071RL
Yageo America
RES, 1.00, 1%, 0.1 W, 0603
0603
16
R4, R7, R10, R11, R16
5
0
CRCW06030000Z0EA
Vishay-Dale
RES, 0, 5%, 0.1 W, 0603
0603
17
R6
1
200k
CRCW0603200KFKEA
Vishay-Dale
RES, 200 k, 1%, 0.1 W, 0603
0603
18
R8
1
1.10k
CRCW06031K10FKEA
Vishay-Dale
RES, 1.10 k, 1%, 0.1 W, 0603
0603
19
R12, R13, R20, R21, R22
5
100k
CRCW0603100KFKEA
Vishay-Dale
RES, 100 k, 1%, 0.1 W, 0603
0603
20
R15
1
10.0k
CRCW060310K0FKEA
Vishay-Dale
RES, 10.0k ohm, 1%, 0.1W, 0603
0603
21
R19
1
61.9k
CRCW060361K9FKEA
Vishay-Dale
RES, 61.9 k, 1%, 0.1 W, 0603
0603
22
R23
1
37.4k
CRCW060337K4FKEA
Vishay-Dale
RES, 37.4 k, 1%, 0.1 W, 0603
0603
23
R24
1
42.2k
CRCW060342K2FKEA
Vishay-Dale
RES, 42.2 k, 1%, 0.1 W, 0603
0603
24
R25
1
25.5k
CRCW060325K5FKEA
Vishay-Dale
RES, 25.5 k, 1%, 0.1 W, 0603
0603
25
TP1, TP5, TP6, TP7, TP8,
TP9, TP12, TP14, TP15,
TP16, TP17
11
White
5012
Keystone
Test Point, Multipurpose, White, TH
White Multipurpose Testpoint
26
TP2, TP3, TP4
3
Red
5010
Keystone
Test Point, Multipurpose, Red, TH
Red Multipurpose Testpoint
27
TP10, TP11, TP13, TP18,
TP19
5
Black
5011
Keystone
Test Point, Multipurpose, Black, TH
Black Multipurpose Testpoint
28
U1
1
TPS548B22RVFR
Texas Instruments
1.5-V to 16-V VIN, 4.5-V to 22-V VDD, 25A SWIFT Synchronous Step-Down Converter
with Full Differential Sense, RVF0040A (LQFNCLIP-40)
RVF0040A
29
C1, C12
0
330uF
6TPE330ML
Sanyo
CAP, TA, 330 µF, 6.3 V, +/- 20%, 0.025 ohm, SMD
7.3x2.8x4.3mm
30
C14, C15, C16, C17, C18,
C19, C20
0
22uF
GRM32ER71E226KE15L
MuRata
CAP, CERM, 22 µF, 25 V, +/- 10%, X7R, 1210
1210
31
C21
0
470pF
GRM188R71H471KA01D
MuRata
CAP, CERM, 470 pF, 50 V, +/- 10%, X7R, 0603
0603
24
Designator
Qty
Value
Part Number
330nH
TPS548B22 SWIFT™ Step-Down Converter Evaluation Module User's Guide
Copyright © 2021 Texas Instruments Incorporated
SLUUBI9A – NOVEMBER 2016 – REVISED AUGUST 2021
Submit Document Feedback
�www.ti.com
List of Materials
Table 11-1. PWR847 List of Materials (continued)
Item#
Designator
Qty
Part Number
Manufacturer
Description
Package Reference
32
C23, C37
0
470uF
2R5TPF470M6L
Panasonic
CAP, Tantalum Polymer, 470 µF, 2.5 V, +/- 20%,
0.006 ohm, 7.3x2.8x4.3mm SMD
7.3x2.8x4.3mm
33
C27, C28, C30, C41, C43
0
100uF
GRM32ER60J107ME20L
MuRata
CAP, CERM, 100 µF, 6.3 V, +/- 20%, X5R, 1210
1210
34
C31
0
0.1uF
GRM188R71H104KA93D
MuRata
CAP, CERM, 0.1 µF, 50 V, +/- 10%, X7R, 0603
0603
35
C32
0
6800pF
GRM188R71H682KA01D
MuRata
CAP, CERM, 6800 pF, 50 V, +/- 10%, X7R, 0603
0603
36
C34, C44
0
1uF
C0603C105K4PACTU
Kemet
CAP, CERM, 1 µF, 16 V, +/- 10%, X5R, 0603
0603
37
C36
0
1000pF
GRM188R71E102KA01D
MuRata
CAP, CERM, 1000 pF, 25 V, +/- 10%, X7R, 0603
0603
38
C46
0
1000pF
C0603C102J5GACTU
Kemet
CAP, CERM, 1000 pF, 50 V, +/- 5%, C0G/NP0,
0603
0603
39
FID1, FID2, FID3, FID4, FID5, 0
FID6
N/A
N/A
Fiducial mark. There is nothing to buy or mount.
Fiducial
40
J6
0
5103308-1
TE Connectivity
Header (shrouded), 100mil, 5x2, Gold, TH
5x2 Shrouded header
41
R2, R3, R14, R17, R18
0
0
CRCW06030000Z0EA
Vishay-Dale
RES, 0, 5%, 0.1 W, 0603
0603
42
R5
0
1.50k
RC0603FR-071K5L
Yageo America
RES, 1.50 k, 1%, 0.1 W, 0603
0603
43
R9
0
3.01
CRCW08053R01FKEA
Vishay-Dale
RES, 3.01 ohm, 1%, 0.125W, 0805
0805
44
TP20, TP21, TP22
0
White
5012
Keystone
Test Point, Multipurpose, White, TH
White Multipurpose Testpoint
SLUUBI9A – NOVEMBER 2016 – REVISED AUGUST 2021
Submit Document Feedback
Value
TPS548B22 SWIFT™ Step-Down Converter Evaluation Module User's Guide
Copyright © 2021 Texas Instruments Incorporated
25
�Revision History
www.ti.com
12 Revision History
NOTE: Page numbers for previous revisions may differ from page numbers in the current version.
Changes from Revision * (November 2016) to Revision A (August 2021)
Page
• Updated user's guide title................................................................................................................................... 3
• Updated the numbering format for tables, figures, and cross-references throughout the document. ................3
26
TPS548B22 SWIFT™ Step-Down Converter Evaluation Module User's Guide
SLUUBI9A – NOVEMBER 2016 – REVISED AUGUST 2021
Submit Document Feedback
Copyright © 2021 Texas Instruments Incorporated
�IMPORTANT NOTICE AND DISCLAIMER
TI PROVIDES TECHNICAL AND RELIABILITY DATA (INCLUDING DATA SHEETS), DESIGN RESOURCES (INCLUDING REFERENCE
DESIGNS), APPLICATION OR OTHER DESIGN ADVICE, WEB TOOLS, SAFETY INFORMATION, AND OTHER RESOURCES “AS IS”
AND WITH ALL FAULTS, AND DISCLAIMS ALL WARRANTIES, EXPRESS AND IMPLIED, INCLUDING WITHOUT LIMITATION ANY
IMPLIED WARRANTIES OF MERCHANTABILITY, FITNESS FOR A PARTICULAR PURPOSE OR NON-INFRINGEMENT OF THIRD
PARTY INTELLECTUAL PROPERTY RIGHTS.
These resources are intended for skilled developers designing with TI products. You are solely responsible for (1) selecting the appropriate
TI products for your application, (2) designing, validating and testing your application, and (3) ensuring your application meets applicable
standards, and any other safety, security, regulatory or other requirements.
These resources are subject to change without notice. TI grants you permission to use these resources only for development of an
application that uses the TI products described in the resource. Other reproduction and display of these resources is prohibited. No license
is granted to any other TI intellectual property right or to any third party intellectual property right. TI disclaims responsibility for, and you
will fully indemnify TI and its representatives against, any claims, damages, costs, losses, and liabilities arising out of your use of these
resources.
TI’s products are provided subject to TI’s Terms of Sale or other applicable terms available either on ti.com or provided in conjunction with
such TI products. TI’s provision of these resources does not expand or otherwise alter TI’s applicable warranties or warranty disclaimers for
TI products.
TI objects to and rejects any additional or different terms you may have proposed. IMPORTANT NOTICE
Mailing Address: Texas Instruments, Post Office Box 655303, Dallas, Texas 75265
Copyright © 2022, Texas Instruments Incorporated
�