DATASHEET
ISL28006
FN6548
Rev 6.00
November 22, 2013
Micropower, Rail to Rail Input Current Sense Amplifier with Voltage Output
The ISL28006 is a micropower, uni-directional high-side and
low-side current sense amplifier featuring a proprietary
rail-to-rail input current sensing amplifier. The ISL28006 is
ideal for high-side current sense applications where the sense
voltage is usually much higher than the amplifier supply
voltage. The device can be used to sense voltages as high as
28V when operating from a supply voltage as low as 2.7V. The
micropower ISL28006 consumes only 50µA of supply current
when operating from a 2.7V to 28V supply.
The ISL28006 features a common-mode input voltage range
from 0V to 28V. The proprietary architecture extends the input
voltage sensing range down to 0V, making it an excellent
choice for low-side ground sensing applications. The benefit of
this architecture is that a high degree of total output accuracy
is maintained over the entire 0V to 28V common mode input
voltage range.
The ISL28006 is available in fixed (100V/V, 50V/V, 20V/V and
Adjustable) gains in the space saving 5 Ld SOT-23 package
and the 6 Ld SOT-23 package for the adjustable gain part. The
parts operate over the extended temperature range from
-40°C to +125°C.
Features
• Low Power Consumption. . . . . . . . . . . . . . . . . . . . . . 50µA, Typ
• Supply Range . . . . . . . . . . . . . . . . . . . . . . . . . . . . . .2.7V to 28V
• Wide Common Mode Input. . . . . . . . . . . . . . . . . . . . 0V to 28V
• Gain Versions
- ISL28006-100 . . . . . . . . . . . . . . . . . . . . . . . . . . . . . . 100V/V
- ISL28006-50 . . . . . . . . . . . . . . . . . . . . . . . . . . . . . . . . 50V/V
- ISL28006-20 . . . . . . . . . . . . . . . . . . . . . . . . . . . . . . . . 20V/V
- ISL28006-ADJ . . . . . . . . . . . . . . . . ADJ (Min Gain = 20V/V)
• Operating Temperature Range . . . . . . . . . . . . -40°C to +125°C
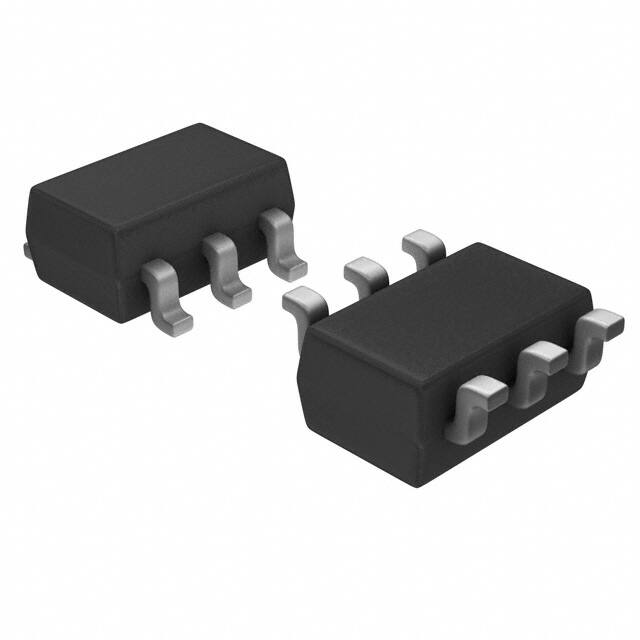
• Packages. . . . . . . . . . . . . . . . . . . . . .5 Ld SOT-23, 6 Ld SOT-23
Applications
• Power Management/Monitors
• Power Distribution and Safety
• DC/DC, AC/DC Converters
• Battery Management/Charging
• Automotive Power Distribution
Related Literature
• See AN1532 for “ISL28006 Evaluation Board User’s Guide”
SENSE
RSENSE
SENSE
+5VDC
RSENSE
+12VDC
OUTPUT
+5VDC
ISL28006
+
-
ISENSE
+12VDC
0.6
+5VDC
OUTPUT
0.2
+5VDC
ISL28006
+
ISENSE
+5VDC
SENSE
+1.0VDC
MULTIPLE
OUTPUT
POWER SUPPLY
RSENSE
+5VDC
ISL28006
+
+1.0VDC
OUTPUT
ISENSE
+1.0VDC
FIGURE 1. TYPICAL APPLICATION
FN6548 Rev 6.00
November 22, 2013
-40°C
+25°C +125°C
GAIN 100
0
-0.2
-0.4
-0.6
-0.8
-1
-1.2
-1.4
GND
+100°C
0.4
ACCURACY (%)
+12VDC
0
2
4
6
8
10 12 14 16 18 20 22 24 26 28
VRS+ (V)
FIGURE 2. GAIN ACCURACY vs VRS+ = 0V TO 28V
Page 1 of 26
�ISL28006
Block Diagram
VCC
I = 2.86µA
VSENSE
VSENSE
HIGH-SIDE
AND
LOW-SIDE
SENSING
RS+
R1
VCC
I = 2.86µA
gmHI
HIGH-SIDE
AND
LOW-SIDE
SENSING
RS+
R1
RS-
gmHI
RSR2
R2
+
1.35V
+
OUT
-
1.35V
Rf
VCC
Rf
VCC
IMIRROR
R3
OUT
-
gmLO
IMIRROR
Rg
R5
FB
R3
Rg
R5
gmLO
VSENSE
VSENSE
R4
R4
GND
GND
FIXED GAIN PARTS
ADJUSTABLE GAIN PART
Pin Configurations
ISL28006-ADJ
(6 LD SOT-23)
TOP VIEW
ISL28006-100, 50, 20
(5 LD SOT-23)
TOP VIEW
GND 1
OUT 2
FB 1
5 RSFIXED
GAIN
VCC 3
6 GND
ADJ.
GAIN
OUT 2
VCC 3
4 RS+
5 RS4 RS+
Pin Descriptions
ISL28006-100, 50, 20
(5 LD SOT-23)
ISL28006-ADJ
(6 LD SOT-23)
PIN NAME
1
6
GND
1
FB
2
2
OUT
Amplifier Output
3
3
VCC
Positive Power Supply
4
4
RS+
Sense Voltage Non-inverting Input
5
5
RS-
Sense Voltage Inverting Input
DESCRIPTION
Power Ground
Input Pin for External Resistors
FB
VCC
RS-
CAPACITIVELY
COUPLED
ESD CLAMP
OUT
RS+
GND
FN6548 Rev 6.00
November 22, 2013
Page 2 of 26
�ISL28006
Ordering Information
PART NUMBER
(Notes 1, 2, 3)
PART
MARKING
GAIN
PACKAGE
Tape & Reel
(Pb-Free)
PKG.
DWG. #
ISL28006FH100Z-T7
100V/V
BDJA (Note 4)
5 Ld SOT-23
P5.064A
ISL28006FH100Z-T7A
100V/V
BDJA (Note 4)
5 Ld SOT-23
P5.064A
ISL28006FH50Z-T7
50V/V
BDHA (Note 4)
5 Ld SOT-23
P5.064A
ISL28006FH50Z-T7A
50V/V
BDHA (Note 4)
5 Ld SOT-23
P5.064A
ISL28006FH20Z-T7
20V/V
BDGA (Note 4)
5 Ld SOT-23
P5.064A
ISL28006FH20Z-T7A
20V/V
BDGA (Note 4)
5 Ld SOT-23
P5.064A
ISL28006FHADJZ-T7
ADJ
BDFA (Note 4)
6 Ld SOT-23
P6.064
ISL28006FHADJZ-T7A
ADJ
BDFA (Note 4)
6 Ld SOT-23
P6.064
ISL28006FH-100EVAL1Z
100V/V Evaluation Board
ISL28006FH-50EVAL1Z
50V/V Evaluation Board
ISL28006FH-20EVAL1Z
20V/V Evaluation Board
ISL28006FH-ADJEVAL1Z
Adjustable Evaluation Board
NOTES:
1. Please refer to TB347 for details on reel specifications.
2. These Intersil Pb-free plastic packaged products employ special Pb-free material sets, molding compounds/die attach materials, and 100% matte
tin plate plus anneal (e3 termination finish, which is RoHS compliant and compatible with both SnPb and Pb-free soldering operations). Intersil
Pb-free products are MSL classified at Pb-free peak reflow temperatures that meet or exceed the Pb-free requirements of IPC/JEDEC J STD-020.
3. For Moisture Sensitivity Level (MSL), please see device information page for ISL28006. For more information on MSL please see techbrief TB363.
4. The part marking is located on the bottom of the part.
FN6548 Rev 6.00
November 22, 2013
Page 3 of 26
�ISL28006
Absolute Maximum Ratings
Thermal Information
Max Supply Voltage . . . . . . . . . . . . . . . . . . . . . . . . . . . . . . . . . . . . . . . . . . 28V
Max Differential Input Current . . . . . . . . . . . . . . . . . . . . . . . . . . . . . . . 20mA
Max Differential Input Voltage . . . . . . . . . . . . . . . . . . . . . . . . . . . . . . . .±0.5V
Max Input Voltage (RS+, RS-, FB) . . . . . . . . . . . . . . . . . . . GND - 0.5V to 30V
Max Input Current for Input Voltage 2V, VSENSE = 5mV
VRS+ > 2V, VSENSE = 5mV
TYP
MAX
(Note 7)
UNIT
50
59
µA
62
µA
62
µA
63
µA
62
µA
63
µA
28
V
50
ADJ Gain = 21
Rf = 100kΩ, Rg = 5kΩ
VRS+ > 2V, VSENSE = 5mV
Supply Voltage
Guaranteed by PSRR
2.7
50
Gain = 100
Pulse on RS+ pin, VOUT = 8VP-P (Figure 75)
0.58
0.76
V/µs
Gain = 50
Pulse on RS+ pin, VOUT = 8VP-P (Figure 75)
0.58
0.67
V/µs
Gain = 20
Pulse on RS+ pin, VOUT = 3.5VP-P (Figure 75)
0.50
0.67
V/µs
ADJ Gain = 21
Rf = 100kΩ, Rg = 5kΩ
Pulse on RS+ pin, VOUT = 3.5VP-P (Figure 75)
0.50
0.67
V/µs
Gain = 100
VRS+ = 12V, 0.1V, VSENSE = 100mV
110
kHz
Gain = 50
VRS+ = 12V, 0.1V, VSENSE = 100mV
160
kHz
Gain = 20
VRS+ = 12V, 0.1V, VSENSE = 100mV
180
kHz
ADJ, Gain = 101 (Figure 65)
VRS+ = 12V, 0.1V, VSENSE = 100mV, Rf = 100kΩ,
Rg = 1kΩ
40
kHz
ADJ, Gain = 51 (Figure 65)
VRS+ = 12V, VSENSE = 100mV, Rf = 100kΩ, Rg = 2kΩ
78
kHz
VRS+ = 0.1V, VSENSE = 100mV, Rf = 100kΩ, Rg = 2kΩ
122
kHz
ADJ, Gain = 21 (Figure 65)
VRS+ = 12V, VSENSE = 100mV, Rf = 100kΩ, Rg = 5kΩ
131
kHz
VRS+ = 0.1V, VSENSE = 100mV, Rf = 100kΩ, Rg = 5kΩ
237
kHz
Output Settling Time to 1% of Final
Value
VCC = VRS+ = 12V, VOUT = 10V step, VSENSE > 7mV
15
µs
VCC = VRS+ = 0.2V, VOUT = 10V step, VSENSE > 7mV
20
µs
Capacitive-Load Stability
No sustained oscillations
300
pF
Power-Up Time to 1% of Final Value
VCC = VRS+ = 12V, VSENSE = 100mV
15
µs
VCC = 12V, VRS+ = 0.2V, VSENSE = 100mV
50
µs
VCC = VRS+ = 12V, VSENSE = 100mV, overdrive
10
µs
Saturation Recovery Time
NOTES:
7. Compliance to datasheet limits is assured by one or more methods: production test, characterization and/or design.
8. DEFINITION OF TERMS:
• VSENSEA = VSENSE @ 100mV
• VSENSEB = VSENSE @ 20mV
• VOUTA = VOUT @ VSENSEA = 100mV
• VOUTB = VOUT @ VSENSEB = 20mV
V OUT A – V OUT B
• G = GAIN = ------------------------------------------------------
V SENSE A – V SENSE B
V OUT A
9. VOS is extrapolated from the gain measurement. V OS = V SENSE A – ----------------G
G MEASURED – G EXPECTED
10. % Gain Accuracy = GA = --------------------------------------------------------------------- 100
G EXPECTED
VOUT MEASURED – VOUT EXPECTED
11. Output Accuracy % VOA = ------------------------------------------------------------------------------------------- 100, where VOUT = VSENSE X GAIN and VSENSE = 100mV
VOUT EXPECTED
FN6548 Rev 6.00
November 22, 2013
Page 6 of 26
�ISL28006
Typical Performance Curves VCC = 12V, RL = 1MΩ, unless otherwise specified.
VRS+
2.0
1.4
VTH(L-H) = 1.52V
1.2
0.8
VOUT (G = 100)
0.6
0.4
0.2
1.2
0
0
0.2
0.4
0.6
0.8 1.0 1.2
TIME (ms)
1.4
1.6
1.8
2.0
FIGURE 3. HIGH-SIDE and LOW-SIDE THRESHOLD VOLTAGE
VRS+(L-H) and VRS+(H-L), VSENSE = 10mV
6
4
G100, VOUT = 2V
G50, VOUT = 1V
G20, VOUT = 400mV
0.4
0
8
RL = 1MΩ
VCC = 12V
0.8
G100, VOUT = 1V
G50, VOUT = 500mV
G20, VOUT = 200mV
10
VOUT (G = 100)
1.6
VTH(H-L) = 1.23V
1.0
VRS+ (V)
VOLTS (V)
12
2.4
VRS+
1.6
0
0.2
0.4
0.6
0.8
1.0 1.2
TIME (ms)
2
1.4
1.6
GAIN 100
10
10
8
8
VOUT (V)
VOUT (V)
0
2.0
12
GAIN 100
6
6
4
4
2
2
0
10
20
30
40
50
60
70
80
90
0
100
0
10
20
30
TIME (µs)
FIGURE 5. LARGE SIGNAL TRANSIENT RESPONSE VRS+ = 0.2V,
VSENSE = 100mV
GAIN 100
18 VSENSE = 20mV, 100mV
16
14
VOS (µV)
12
10
8
6
4
2
0
-250
-200
-150
-100 -50
VOS (µV)
0
50
100
FIGURE 7. VOS (µV) DISTRIBUTION AT +25°C, VRS+ = 12V,
QUANTITY: 100
FN6548 Rev 6.00
November 22, 2013
40
50
60
TIME (µs)
70
80
90
100
FIGURE 6. LARGE SIGNAL TRANSIENT RESPONSE VRS+ = 12V,
VSENSE = 100mV
20
UNITS
1.8
FIGURE 4. VOUT vs VRS+, VSENSE = 20mV TRANSIENT RESPONSE
12
0
VOUT (V)
1.8
2800
2600
2400
2200
2000
1800
1600
1400
1200
1000
800
600
400
200
0
-200
-400
GAIN 100
VSENSE = 20mV, 100mV
+125°C
+100°C
-40°C
0
2
4
6
8
+25°C
10 12 14 16 18 20 22 24 26 28
VRS+ (V)
FIGURE 8. VOS vs VRS+
Page 7 of 26
�ISL28006
Typical Performance Curves VCC = 12V, RL = 1MΩ, unless otherwise specified. (Continued)
250
GAIN 100
VSENSE = 20mV, 100mV
+125°C
+100°C
200
150
+100°C
+25°C
100
VOS (µV)
VOS (µV)
2800
2600
2400
2200
2000
1800
1600
1400
1200
1000
800
600
400
200
0
-200
-400
+25°C
-40°C
50
0
-50
-40°C
-100
+125°C
-150
GAIN 100
VSENSE = 2mV, 20mV
-200
0
0.2
0.4
0.6
0.8
1.0
1.2
1.4
1.6
1.8
-250
2
2.0
4
6
8
VRS+ (V)
FIGURE 9. VOS vs VRS+
3000
+100°C
FIGURE 10. VOS vs VCC, VRS+= 12V
0.6
GAIN 100
VSENSE = 2mV, 20mV
+25°C
2000
+100°C
0.4
-40°C
ACCURACY (%)
-40°C
+125°C
0
-1000
0
-0.2
-0.4
-0.6
-0.8
-1.0
-2000
GAIN 100
VSENSE = 20mV, 100mV
-1.2
-3000
2
4
6
8
-1.4
10 12 14 16 18 20 22 24 26 28
VCC (V)
FIGURE 11. VOS vs VCC, VRS+ = 0.1V
0.6
+100°C
0
ACCURACY (%)
ACCURACY (%)
0.2
-0.2
-0.4
-40°C
-0.6
+125°C
-0.8
-1.0
GAIN 100
VSENSE = 20mV, 100mV
-1.2
0
0.2
0.4
0.6
0.8 1.0 1.2
VRS+ (V)
1.4
1.6
1.8
FIGURE 13. GAIN ACCURACY vs VRS+ = 0V TO 2V
FN6548 Rev 6.00
November 22, 2013
0
2
4
6
8
10 12 14 16 18 20 22 24 26 28
VRS+ (V)
FIGURE 12. GAIN ACCURACY vs VRS+ = 0V TO 28V
+25°C
0.4
-1.4
+25°C +125°C
0.2
1000
VOS (µV)
10 12 14 16 18 20 22 24 26 28
VCC (V)
2.0
3.0
2.5
2.0
1.5
1.0
0.5
0
-0.5
-1.0
-1.5
-2.0
-2.5
-3.0
-3.5
-4.0
-4.5
-5
+100°C
+25°C
-40°C
+125°C
GAIN 100
VSENSE = 2mV, 20mV
2
4
6
8
10 12 14 16 18 20 22 24 26 28
VCC (V)
FIGURE 14. GAIN ACCURACY vs VCC, VRS+ = 12V
Page 8 of 26
�ISL28006
Typical Performance Curves VCC = 12V, RL = 1MΩ, unless otherwise specified. (Continued)
0.2
0
0.1
ACCURACY (%)
-2
+25°C
-4
-40°C
+100°C
-6
-8
+125°C
-10
-12
-14
-16
GAIN 100
VSENSE = 2mV, 20mV
-18
-20
2
4
6
8
VOA PERCENT ACCURACY (%)
2
GAIN 100
0.0
-0.1
-0.2
-0.3
-40°C
-0.4
+125°C
-0.5
-0.6
+100°C
-0.7
-0.8
-0.9
+25°C
-1.0
1µ
10 12 14 16 18 20 22 24 26 28
10µ
100µ
IOUT(A)
VCC (V)
FIGURE 15. GAIN ACCURACY vs VCC, VRS+ = 0.1V
40
35 GAIN 100
20
GAIN 100
VSENSE = 20mV, 100mV
VRS+ = 12V
0
15
VOS (µV)
GAIN (dB)
25
VRS+= 100mV
5
-5
VCC = 12V
-15 V
SENSE = 100mV
AV = 100
-25
RL = 1MΩ
-35
10
100
VRS+ = 12V
-20
-40
-60
-80
1k
10k
FREQUENCY (Hz)
100k
-100
-50
1M
FIGURE 17. GAIN vs FREQUENCY VRS+ = 100mV/12V,
VSENSE = 100mV, VOUT = 50mVP-P
180
100pF
1000pF
30
25
50
75
TEMPERATURE (°C)
100
125
PHASE (°)
10nF
0
VCC = 5V
VRS- = 3V
AV = 100
VOUT = 400mVP-P
-40
1.E+03
1.E+04
-20
-60
-180
1.E+06
FIGURE 19. CAPACITIVE LOAD DRIVE GAIN vs FREQUENCY
10nF
20
-140
FREQUENCY (Hz)
FN6548 Rev 6.00
November 22, 2013
60
-100
1.E+05
NO CL
4.7nF
100
NO CL
10
100pF
1000pF
140
4.7nF
20
GAIN (dB)
0
220
40
-30
-25
FIGURE 18. VOS (µV) vs TEMPERATURE
50
-20
10m
FIGURE 16. NORMALIZED VOA vs IOUT
45
-10
1m
VCC = 5V
VRS- = 3V
AV = 100
VOUT = 400mVP-P
-220
1.E+03
1.E+04
1.E+05
1.E+06
FREQUENCY (Hz)
FIGURE 20. CAPACITIVE LOAD DRIVE PHASE vs FREQUENCY
Page 9 of 26
�ISL28006
Typical Performance Curves VCC = 12V, RL = 1MΩ, unless otherwise specified. (Continued)
0.30
0.25
0.20
GAIN 100
VRS+ = 12V
-0.6
VOUT ERROR (%)
GAIN ACCURACY (%)
-0.5
GAIN 100
VSENSE = 20mV, 100mV
VRS+ = 12V
0.15
0.10
0.05
0
-0.7
-0.8
-0.9
-0.05
-0.10
-50
-25
0
25
50
75
100
-1
-50
125
-25
0
TEMPERATURE (°C)
FIGURE 21. GAIN ACCURACY (%) vs TEMPERATURE
GAIN 50
18 VSENSE = 20mV, 100mV
16
12
VOS (µV)
UNITS
14
10
8
6
4
2
-250
-200
-150
-100 -50
VOS (µV)
0
50
100
2800
2600
2400
2200
2000
1800
1600
1400
1200
1000
800
600
400
200
0
-200
-400
+125°C
-40°C
0
2
4
6
8
+25°C
10 12 14 16 18 20 22 24 26 28
FIGURE 24. VOS vs VRS+
250
GAIN 50
VSENSE = 2mV, 0mV
200
150
+100°C
+100°C
100
VOS (µV)
VOS (µV)
+100°C
VRS+ (V)
GAIN 50
VSENSE = 20mV, 100mV
+125°C
125
GAIN 50
VSENSE = 20mV, 100mV
FIGURE 23. VOS (µV) DISTRIBUTION AT +25°C, VRS+ = 12V,
QUANTITY: 100
2800
2600
2400
2200
2000
1800
1600
1400
1200
1000
800
600
400
200
0
-200
-400
100
FIGURE 22. VOUT ERROR (%) vs TEMPERATURE
20
0
25
50
75
TEMPERATURE (°C)
+25°C
-40°C
50
+125°C
0
-50
+25°C
-100
-150
-40°C
-200
0
0.2
0.4
0.6
0.8
1.0
1.2
VRS+ (V)
FIGURE 25. VOS vs VRS+
FN6548 Rev 6.00
November 22, 2013
1.4
1.6
1.8
2.0
-250
2
4
6
8
10 12 14 16 18 20 22 24 26 28
VCC (V)
FIGURE 26. VOS vs VCC, VRS+ = 12V
Page 10 of 26
�ISL28006
Typical Performance Curves VCC = 12V, RL = 1MΩ, unless otherwise specified. (Continued)
3000
+100°C
0.6
+25°C
0.4
2000
ACCURACY (%)
VOS (µV)
1000
-40°C
+125°C
0
-1000
GAIN 50
VSENSE = 2mV, 0mV
2
4
6
8
0.4
+25°C
0
ACCURACY (%)
ACCURACY (%)
-0.8
-0.2
-0.4
+100°C
-0.6
-0.8
-1.0
-40°C
+125°C
-1.2
0
0.2
0.4
0.6
GAIN 50
VSENSE = 20mV, 100mV
0.8 1.0 1.2
VRS+ (V)
1.4
1.6
1.8
2.0
FIGURE 29. GAIN ACCURACY vs VRS+ = 0V TO 2V
3.0
2.5
2.0
1.5
1.0
0.5
0
-0.5
-1.0
-1.5
-2.0
-2.5
-3.0
-3.5
-4.0
-4.5
-5.0
0
0.1
+25°C
-40°C
+100°C
-6
-8
-10
-12
+125°C
-14
-16
GAIN 50
VSENSE = 2mV, 20mV
-18
2
4
6
8
10 12 14 16 18 20 22 24 26 28
VCC (V)
FIGURE 31. GAIN ACCURACY vs VCC, LOW-SIDE
FN6548 Rev 6.00
November 22, 2013
VOA PERCENT ACCURACY (%)
0.2
-4
0
2
4
6
8
10 12 14 16 18 20 22 24 26 28
VRS+ (V)
+100°C
+25°C
-40°C
+125°C
GAIN 50
VSENSE = 2mV, 20mV
2
4
6
8
10 12 14 16 18 20 22 24 26 28
VCC (V)
FIGURE 30. GAIN ACCURACY vs VCC, HIGH-SIDE
2
-2
GAIN 50
VSENSE = 20mV, 100mV
FIGURE 28. GAIN ACCURACY vs VRS+ = 0V TO 28V
0.2
ACCURACY (%)
+125°C
-0.6
-1.4
10 12 14 16 18 20 22 24 26 28
VCC (V)
0.6
-20
+100°C
-0.4
-1.2
FIGURE 27. VOS vs VCC, VRS+ = VRS+ = 0.1V
-1.4
0
-0.2
-1.0
-2000
-3000
-40°C
+25°C
0.2
GAIN 50
0.0
-0.1
-0.2
-0.3
-40°C
-0.4
-0.5
+125°C
-0.6
-0.7
+100°C
-0.8
-0.9
-1.0
1µ
+25°C
10µ
100µ
IOUT(A)
1m
10m
FIGURE 32. NORMALIZED VOA vs IOUT
Page 11 of 26
�ISL28006
Typical Performance Curves VCC = 12V, RL = 1MΩ, unless otherwise specified. (Continued)
-70
GAIN 50
35
-90
25
-110
15
VOS (µV)
GAIN (dB)
45
VRS+= 100mV
5
-5
VRS+ = 12V
VCC = 12V
-15 V
SENSE = 100mV
-25 AV = 50
RL = 1MΩ
-35
10
100
GAIN 50
VSENSE = 20mV, 100mV
VRS+ = 12V
-130
-150
-170
-190
-210
1k
10k
FREQUENCY (Hz)
100k
-230
-50
1M
FIGURE 33. GAIN vs FREQUENCY VRS+ = 100mV/12V,
VSENSE = 100mV, VOUT = 50mVP-P
220
40
180
1000pF
0
-10
-20
-30
10nF
VCC = 5V
-60
-180
1.E+05
10nF
-20
-140
1.E+04
VCC = 5V
VRS- = 3V
AV = 50
VOUT = 400mVP-P
-220
1.E+03
1.E+06
1.E+04
FREQUENCY (Hz)
0.10
GAIN 50
0.08
VRS+ = 12V
0.06
VOUT ERROR (%)
GAIN ACCURACY (%)
0.16
1.E+06
FIGURE 36. CAPACITIVE LOAD DRIVE PHASE vs FREQUENCY
GAIN 50
VSENSE = 20mV, 100mV
VRS+ = 12V
0.17
1.E+05
FREQUENCY (Hz)
FIGURE 35. CAPACITIVE LOAD DRIVE GAIN vs FREQUENCY
0.18
100pF
20
-100
VRS- = 3V
AV = 50
VOUT = 400mVP-P
-40
1.E+03
125
NO CL
60
NO CL
10
100
4.7nF
100
PHASE (°)
GAIN (dB)
20
25
50
75
TEMPERATURE (°C)
1000pF
140
100pF
4.7nF
0
FIGURE 34. VOS (µV) vs TEMPERATURE
50
30
-25
0.15
0.14
0.13
0.12
0.04
0.02
0
-0.02
-0.04
-0.06
-0.08
0.11
0.1
-50
-0.10
-25
0
25
50
75
100
TEMPERATURE (°C)
FIGURE 37. GAIN ACCURACY (%) vs TEMPERATURE
FN6548 Rev 6.00
November 22, 2013
125
-0.12
-50
-25
0
25
50
75
TEMPERATURE (°C)
100
125
FIGURE 38. V OUT ERROR (%) vs TEMPERATURE
Page 12 of 26
�ISL28006
Typical Performance Curves VCC = 12V, RL = 1MΩ, unless otherwise specified. (Continued)
30
2800
2600
2400
2200
2000
1800
1600
1400
1200
1000
800
600
400
200
0
-200
-400
GAIN 20
VSENSE = 20mV, 100mV
25
VOS (µV)
UNITS
20
15
10
5
0
-250
-200
-150
-100
-50
0
VOS (µV)
50
100
150
GAIN 20
VSENSE = 20mV, 100mV
0
2
4
GAIN 20
VSENSE = 2mV, 20mV
150
100
+25°C
-40°C
+100°C
50
0
+25°C
-50
-40°C
-100
+125°C
-150
-200
0
0.2
0.4
0.6
0.8
1
1.2
1.4
1.6
1.8
-250
2
2
FIGURE 41. VOS vs VRS+
3000
+100°C
4
6
8
10 12 14 16 18 20 22 24 26 28
VCC (V)
+25°C
FIGURE 42. VOS vs VCC, VRS+ = 12V
0.6
GAIN 20
VSENSE = 2mV, 20mV
0.4
2000
+125°C
0
-1000
ACCURACY (%)
-40°C
-40°C
+25°C
0.2
1000
VOS (µV)
10 12 14 16 18 20 22 24 26 28
200
VRS+ (V)
0
-0.2
+125°C
-0.4
+100°C
-0.6
-0.8
-1.0
-2000
GAIN 20
VSENSE = 20mV, 100mV
-1.2
-3000
+25°C
250
GAIN 20
VSENSE = 20mV, 100mV
+125°C
-40°C
FIGURE 40. VOS vs VRS+
VOS (µV)
VOS (µV)
+100°C
8
+100°C
VRS+ (V)
FIGURE 39. VOS (µV) DISTRIBUTION AT +25°C, VRS+ = 12V,
QUANTITY: 100
2800
2600
2400
2200
2000
1800
1600
1400
1200
1000
800
600
400
200
0
-200
-400
6
+125°C
2
4
6
8
10 12 14 16 18 20 22 24 26 28
VCC (V)
FIGURE 43. VOS vs VCC, VRS+ = 0.1V
FN6548 Rev 6.00
November 22, 2013
-1.4
0
2
4
6
8
10 12 14 16 18 20 22 24 26 28
VRS+ (V)
FIGURE 44. GAIN ACCURACY vs VRS+ = 0V TO 28V
Page 13 of 26
�ISL28006
Typical Performance Curves VCC = 12V, RL = 1MΩ, unless otherwise specified. (Continued)
0.6
GAIN 20
VSENSE = 20mV, 100mV
0.4
+25°C
0
ACCURACY (%)
ACCURACY (%)
0.2
-0.2
-0.4
-0.6
+100°C
-40°C
-0.8
-1.0
-1.2
-1.4
+125°C
0
0.2
0.4
0.6
0.8 1.0 1.2
VRS+ (V)
1.4
1.6
1.8
2.0
FIGURE 45. GAIN ACCURACY vs VRS+ = 0V TO 2V
0.2
0
0.1
VOA PERCENT ACCURACY (%)
2
-4
+25°C
+100°C
-6
-40°C
-8
-10
-12
+125°C
-14
-16
GAIN 20
VSENSE = 2mV, 20mV
-18
-20
2
4
6
8
GAIN 20
VSENSE = 2mV, 20mV
+100°C
2
4
6
8
10 12 14 16 18 20 22 24 26 28
VCC (V)
GAIN 20
0.0
-0.1
-0.2
+25°C
-0.3
-0.4
+125°C
-0.5
-0.6
+100°C
-0.7
-0.8
-40°C
-0.9
10µ
VCC (V)
FIGURE 47. GAIN ACCURACY vs VCC, LOW-SIDE
100µ
IOUT(A)
1m
10m
FIGURE 48. NORMALIZED VOA vs IOUT
-20
GAIN 20
35
GAIN 20
VSENSE = 20mV, 100mV
VRS+ = 12V
-40
25
-60
15
VOS (µV)
GAIN (dB)
-40°C
+125°C
-1.0
1µ
10 12 14 16 18 20 22 24 26 28
45
+25°C
FIGURE 46. GAIN ACCURACY vs VCC, HIGH-SIDE
-2
ACCURACY (%)
3.0
2.5
2.0
1.5
1.0
0.5
0
-0.5
-1.0
-1.5
-2.0
-2.5
-3.0
-3.5
-4.0
-4.5
-5.0
VRS+ = 100mV
5
-5
VCC = 12V
-15 V
SENSE = 100mV
A = 20
-25 V
RL = 1MΩ
-35
10
100
VRS+ = 12V
-100
-120
1k
10k
FREQUENCY (Hz)
100k
FIGURE 49. GAIN vs FREQUENCY VRS+ = 100mV/12V,
VSENSE = 100mV, VOUT = 50mVP-P
FN6548 Rev 6.00
November 22, 2013
-80
1M
-140
-50
-25
0
25
50
75
TEMPERATURE (°C)
100
125
FIGURE 50. VOS (µV) vs TEMPERATURE
Page 14 of 26
�ISL28006
Typical Performance Curves VCC = 12V, RL = 1MΩ, unless otherwise specified. (Continued)
40
220
1000pF
180
30
4.7nF
100
NO CL
10
10nF
0
-10
-20
VCC = 5V
VRS- = 3V
-30 AV = 20
VOUT = 400mVP-P
-40
1.E+03
1.E+04
1.E+05
10nF
20
-20
-60
-100 VCC = 5V
V
= 3V
-140 RSAV = 20
-180 V
OUT = 400mVP-P
-220
1.E+03
1.E+04
1.E+06
FREQUENCY (Hz)
0.31
0.3150
0.310
0.305
0.27
0.25
0.23
0.21
0.300
0.19
0.295
0.17
0.290
-50
-25
0
25
50
75
100
GAIN 20
VRS+ = 12V
0.29
VOUT ERROR (%)
GAIN ACCURACY (%)
0.320
0.15
-50
125
-25
0
TEMPERATURE (°C)
UNITS
VOS (µV)
80
120 160 200
FIGURE 55. VOS (µV) DISTRIBUTION AT +25°C, VRS+ = 12V,
QUANTITY: 100
FN6548 Rev 6.00
November 22, 2013
25
50
75
TEMPERATURE (°C)
100
125
FIGURE 54. VOUT ERROR (%) vs TEMPERATURE
FIGURE 53. GAIN ACCURACY (%) vs TEMPERATURE
26
GAIN 101 ADJ
24
Rf = 100k, Rg = 1k
22
VSENSE = 20mV, 100mV
20
18
16
14
12
10
8
6
4
2
0
-200 -160 -120 -80 -40 0
40
VOS (µV)
1.E+06
FIGURE 52. CAPACITIVE LOAD DRIVE PHASE VS FREQUENCY
GAIN 20
VSENSE = 20mV, 100mV
VRS+ = 12V
0.325
1.E+05
FREQUENCY (Hz)
FIGURE 51. CAPACITIVE LOAD DRIVE GAIN VS FREQUENCY
0.330
NO CL
4.7nF
60
PHASE (°)
GAIN (dB)
20
100pF
1000pF
140
100pF
2800
2600
2400
2200
2000
1800
1600
1400
1200
1000
800
600
400
200
0
-200
-400
GAIN 101 ADJ
Rf = 100k, Rg = 1k
VSENSE = 20mV, 100mV
+125°C
+100°C
-40°C
0
2
4
6
8
+25°C
10 12 14 16 18 20 22 24 26 28
VRS+ (V)
FIGURE 56. VOS vs VRS+
Page 15 of 26
�ISL28006
Typical Performance Curves VCC = 12V, RL = 1MΩ, unless otherwise specified. (Continued)
250
GAIN 101 ADJ
Rf = 100k, Rg = 1k
VSENSE = 20mV, 100mV
150
+125°C
100
+25°C
-40°C
GAIN 101 ADJ
Rf = 100k, Rg = 1k
VSENSE = 2mV, 20mV
200
VOS (µV)
VOS (µV)
2800
2600
2400
2200
2000
1800
1600
1400
1200
1000
800
600
400
200
0
-200
-400
+100°C
50
+25°C
0
-50
-100
+100°C
-40°C
-150
-200
0
0.2
0.4
0.6
0.8
1.0
1.2
1.4
1.6
1.8
+125°C
-250
2
2.0
4
6
8
VRS+ (V)
FIGURE 57. VOS vs VRS+
+100°C
2000
+25°C
FIGURE 58. VOS vs VCC, HIGH-SIDE
1000
VOS (µV)
0.6
GAIN 101 ADJ
Rf = 100k, Rg = 1k
VSENSE = 2mV, 20mV
-40°C
+125°C
0
0.4
-1000
+125°C
+100°C
0.2
ACCURACY (%)
3000
10 12 14 16 18 20 22 24 26 28
VCC (V)
GAIN 101 ADJ
Rf = 100k, Rg = 1k
VSENSE = 20mV, 100mV
0
-0.2
+25°C
-0.4
-40°C
-0.6
-0.8
-1.0
-2000
-1.2
-3000
2
4
6
8
-1.4
10 12 14 16 18 20 22 24 26 28
VCC (V)
FIGURE 59. VOS vs VCC, LOW-SIDE
0.6
0
+100°C
+125°C
ACCURACY (%)
ACCURACY (%)
0.2
-0.2
-0.4
-0.6
+25°C
-40°C
-0.8
-1.0
-1.2
-1.4
0
0.2
0.4
0.6
0.8 1.0 1.2
VRS+ (V)
1.4
1.6
1.8
FIGURE 61. GAIN ACCURACY vs VRS+ = 0V TO 2V
FN6548 Rev 6.00
November 22, 2013
2
4
6
8
10 12 14 16 18 20 22 24 26 28
VRS+ (V)
FIGURE 60. GAIN ACCURACY vs VRS+ = 0V TO 28V
GAIN 101 ADJ
Rf = 100k, Rg = 1k
VSENSE = 20mV, 100mV
0.4
0
2.0
3.0
2.5
2.0
1.5
1.0
0.5
0
-0.5
-1.0
-1.5
-2.0
-2.5
-3.0
-3.5
-4.0
-4.5
-5.0
-40°C
+100°C
+25°C
GAIN 101 ADJ
Rf = 100k, Rg = 1k
VSENSE = 2mV, 20mV
+125°C
2
4
6
8
10 12 14 16 18 20 22 24 26 28
VCC (V)
FIGURE 62. GAIN ACCURACY vs VCC, VRS+ = 12V
Page 16 of 26
�ISL28006
Typical Performance Curves VCC = 12V, RL = 1MΩ, unless otherwise specified. (Continued)
0.2
0.0
2
ACCURACY (%)
-2
+100°C +25°C -40°C
-4
-6
-8
+125°C
-10
-12
-14
GAIN 101 ADJ
Rf = 100k, Rg = 1k
VSENSE = 2mV, 20mV
-16
-18
-20
2
4
6
8
VOA PERCENT ACCURACY (%)
0
10 12 14 16 18 20 22 24 26 28
+25°C
-0.2
-40°C
-0.4
-0.6 GAIN 101 ADJ
R = 100k
-0.8 Rf = 1k
g
-1.0
0.2
0.0
-0.2
-0.4
-0.6 GAIN 21 ADJ
-0.8 Rf = 100k
R = 5k
-1.0 g
1µ
10µ
+100°C
+125°C
+25°C
-40°C
+100°C
+125°C
100µ
IOUT(A)
VCC (V)
FIGURE 63. GAIN ACCURACY vs VCC, VRS+ = 0.1V
45
GAIN (dB)
30
VRS+ = 0.1V GAIN = 21
VRS+ = 12V GAIN = 21
0
-50
GAIN = 21
-100
-150
GAIN = 101
-200
-250
-300
-350
-50
1M
FIGURE 65. GAIN vs FREQUENCY VRS+ = 100mV/12V,
VSENSE = 100mV, VOUT = 50mVP-P
-25
0
25
50
75
TEMPERATURE (°C)
100
125
FIGURE 66. VOS (µV) vs TEMPERATURE
0.6
0.40
0.35
0.5
GAIN = 101
0.30
VOUT ERROR (%)
GAIN ACCURACY (%)
GAIN = 21, 101
Rf = 100k
Rg = 1k, 5k
RL = 1MΩ
50
10 GAIN = 21, 51, 101
Rf = 100k
5 Rg = 1k, 2k, 5k
VRS+ = 12V GAIN = 51
RL = 1MΩ
0
100
1k
10k
100k
FREQUENCY (Hz)
0.25
0.20
0.15
VRS+ = 12V
100
VRS+ = 12V GAIN = 51
VCC = 12V
15 VSENSE = 100mV
VSENSE = 20mV, 100mV
150
VRS+ = 0.1V GAIN = 101
25
20
200
VOS (µV)
35
10m
FIGURE 64. NORMALIZED VOA vs IOUT
VRS+ = 12V GAIN = 101
40
1m
VSENSE = 20mV, 100mV
VRS+ = 12V
0.10 GAIN = 21, 101
Rf = 100k
0.05 Rg = 1k, 5k
RL = 1MΩ
0
-50
-25
0
GAIN = 21
25
50
75
100
TEMPERATURE (°C)
FIGURE 67. GAIN ACCURACY (%) vs TEMPERATURE
FN6548 Rev 6.00
November 22, 2013
125
0.4
GAIN = 101
0.3
0.2
0.1
VSENSE = 20mV, 100mV
VRS+ = 12V
0 GAIN = 21, 101
Rf = 100k
-0.1 Rg = 1k, 5k
RL = 1MΩ
-0.2
-50
-25
0
GAIN = 21
25
50
75
100
125
TEMPERATURE (°C)
FIGURE 68. VOUT ERROR (%) vs TEMPERATURE
Page 17 of 26
�ISL28006
Typical Performance Curves VCC = 12V, RL = 1MΩ, unless otherwise specified. (Continued)
20
10
15
IRS+
INPUT BIAS CURRENT (µA)
INPUT BIAS CURRENT (µA)
15
5
0
VCC = 12V
VRS- = 0V
AV = 20
RL = 1M
-5
-10
-15
0
IRS+
50
100
150
200
VCC = 12V
VRS- = 12V
AV = 20
RL = 1M
5
0
IRS+
-5
-10
250
IRS+
10
0
50
100
150
200
250
DIFFERENTIAL VOLTAGE RS+ TO RS- (mV)
DIFFERENTIAL VOLTAGE RS+ TO RS- (mV)
FIGURE 69. LOW SIDE CURRENT SENSING INPUT BIAS CURRENTS
FIGURE 70. HIGH SIDE CURRENT SENSING INPUT BIAS CURRENTS
Test Circuits and Waveforms
VCC
VR1
ICC
+
+
VRS+
VSENSE
RS+
+
VSENSE
VRS+
GND
-
1MΩ
RS+
+
OUT
RS-
VCC
R1
RL
-
-
VOUT
R2
OUT
RSGND
1MΩ
RL VOUT
VR2
FIGURE 71. ICC, VOS, VOA, CMRR, PSRR, GAIN ACCURACY
FIGURE 72. INPUT BIAS CURRENT, LEAKAGE CURRENT
VCC
RS+
SIGNAL
GENERATOR
OUT
RS+
RS-
VRS+
VRS-
GND
1MΩ
VCC
VSENSE
VRS+
RL VOUT
OUT
RSGND
1MΩ
RL VOUT
PULSE GENERATOR
FIGURE 73. ts, SATURATION RECOVERY TIME
FIGURE 74. GAIN vs FREQUENCY
VCC
RS+
OUT
RS-
VRS+
GND
1MΩ
RL
VOUT
PULSE
GENERATOR
FIGURE 75. SLEW RATE
FN6548 Rev 6.00
November 22, 2013
Page 18 of 26
�ISL28006
Applications Information
gain resistors to set the gain of the output. For the fixed gain
amps the only external component needed is a current sense
resistor (typically 0.001Ω to 0.01Ω, 1W to 2W).
Functional Description
The ISL28006-20, ISL28006-50 and ISL28006-100 are single
supply, uni-directional current sense amplifiers with fixed gains
of 20V/V, 50V/V and 100V/V respectively. The ISL28006-ADJ is
single supply, uni-directional current sense amplifier with an
adjustable gain via external resistors (see Figure 80). The
ISL28006-ADJ is stable for gains of 20 and higher.
The transfer function for the fixed gain parts is given in
Equation 1.
The ISL28006 is a 2-stage amplifier. Figure 76 shows the active
circuitry for high-side current sense applications where the sense
voltage is between 1.35V to 28V. Figure 77 shows the active
circuitry for ground sense applications where the sense voltage is
between 0V to 1.35V.
RF
V OUT = 1 + ------- I S R S + V OS
R
G
The first stage is a bi-level trans-conductance amp and level
translator. The gm stage converts the low voltage drop (VSENSE)
sensed across an external milli-ohm sense resistor, to a current
(@ gm = 21.3µA/V). The trans-conductance amplifier forces a
current through R1 resulting to a voltage drop across R1 that is
equal to the sense voltage (VSENSE). The current through R1 is
mirrored across R5 creating a ground-referenced voltage at the
input of the second amplifier equal to VSENSE.
The second stage is responsible for the overall gain and
frequency response performance of the device. The fixed gains
(20, 50, 100) are set with internal resistors Rf and Rg. The
variable gain (ADJ) has an additional FB pin and uses external
V OUT = GAIN I S R S + V OS
(EQ. 1)
The transfer function for the adjustable gain part is given in
Equation 2.
(EQ. 2)
Where ISRS is the product of the load current and the sense
resistor and is equal to VSENSE.
When the sensed input voltage is >1.35V, the gmHI amplifier
path is selected and the input gm stage derives its ~2.86µA
supply current from the input source through the RS+ terminal.
When the sense voltage at RS+ drops below the 1.35V threshold,
the gmLO amplifier is enabled for Low Side current sensing. The
gmLO input bias current reverses, flowing out of the RS- pin.
Since the gmLO amplifier is sensing voltage around ground, it
cannot source current to R5. A current mirror referenced off Vcc
supplies the current to the second stage for generating a ground
referenced output voltage. See Figures 69 and 70 for typical
input bias currents for High and Low side current sensing.
VCC
OPTIONAL
FILTER
CAPACITOR
I = 2.86µA
VSENSE
IS
RS+
+
RS
R1
VSENSE
gmHI
HIGH-SIDE
SENSING
VRS+ = 2V TO 28V
-
VCC = 2V to 28V
RSR2
+
OPTIONAL
TRANSIENT
PROTECTION
OUT
-
1.35V
Rf
IMIRROR
R3
gmLO
‘VSENSE
Rg
R5
LOAD
R4
GND
FIGURE 76. HIGH-SIDE CURRENT DETECTION
FN6548 Rev 6.00
November 22, 2013
Page 19 of 26
�ISL28006
VCC = 2V TO 28V
VCC
OPTIONAL
FILTER
CAPACITOR
I = 2.86µA
VSENSE
IS
RS+
+
-
RS
R1
VSENSE
LOW-SIDE
SENSING
VRS+= 0V TO 28V
gmHI
RSR2
LOAD
+
OPTIONAL
TRANSIENT
PROTECTION
1.35V
R3
VCC
IMIRROR
gmLO
R5
OUT
Rf
Rg
VSENSE
R4
GND
FIGURE 77. LOW-SIDE CURRENT DETECTION
FN6548 Rev 6.00
November 22, 2013
Page 20 of 26
�ISL28006
Hysteretic Comparator
The input trans-conductance amps are under control of a
hysteretic comparator operating from the incoming source
voltage on the RS+ pin (Figure 78). The comparator monitors the
voltage on RS+ and switches the sense amplifier from the
low-side gm amp to the high-side gm amplifier whenever the
input voltage at RS+ increases above the 1.35V threshold.
Conversely, a decreasing voltage on the RS+ pin, causes the
hysteric comparator to switch from the high-side gm amp to the
low-side gm amp as the voltage decreases below 1.35V. It is that
low-side sense gm amplifier that gives the ISL28006 the
proprietary ability to sense current all the way to 0V. Negative
voltages on the RS+ or RS- are beyond the sensing voltage range
of this amplifier.
0.5
0.4
ACCURACY (%)
0.3
0.2
0.1
0
-0.1
-0.2
-0.3
R P I RS- = 100 130nA = 13V
(EQ. 3)
Switching applications can generate voltage spikes that can
overdrive the amplifier input and drive the output of the amplifier
into the rails, resulting in a long overload recover time.
Capacitors CM and CD filter the common mode and differential
voltage spikes.
Error Sources
There are 3 dominant error sources: gain error, input offset
voltage error and Kelvin voltage error (see Figure 79). The gain
error is dominated by the internal resistance matching
tolerances. The remaining errors appear as sense voltage errors
at the input to the amplifier. They are VOS of the amplifier and
Kelvin voltage errors. If the transient protection resistor is added,
an additional VOS error can result from the IxR voltage due to
input bias current. The limiting resistor should only be added to
the RS- input, due to the high-side gm amplifier (gmHI) sinking
several micro amps of current through the RS+ pin.
Layout Guidelines
-0.4
-0.5
value of 100Ω will provide protection for a 2V transient with the
maximum of 20mA flowing through the input while adding only
an additional 13µV (worse case over-temperature) of VOS. Refer
to Equation 3:
0
0.2
0.4
0.6
0.8 1.0 1.2
VRS+ (V)
1.4
1.6
1.8
2.0
The Kelvin Connected Sense Resistor
FIGURE 78. GAIN ACCURACY vs VRS+ = 0V TO 2V
Typical Application Circuit
Figure 80 shows the basic application circuit and optional
protection components for switched-load applications. For
applications where the load and the power source is permanently
connected, only an external sense resistor is needed. For
applications where fast transients are caused by hot plugging the
source or load, external protection components may be needed.
The external current limiting resistor (RP) in Figure 80 may be
required to limit the peak current through the internal ESD
diodes to


 工商网监
湘ICP备2023018690号
工商网监
湘ICP备2023018690号
