Test Procedure for the DUALASYMB12VGEVB Evaluation Board
Needed Equipment
1 Voltage Sources:
(i) DC Supply Source for Input Voltage: The input voltage source should be a 0 to 20V DC source. The
input voltage may be increased further depending on the parts that are being used on the
DUALASYMA5VGEVB evaluation board such that the part can withstand the applied voltage. Hence,
based on the required input voltage to be applied, the requirement of the DC power supply varies.
(ii) DC Supply Source for Driver Voltage: The supply source for the driver should be a 0 to 20V DC
source. The driver voltage varies depending on the type of driver used (i.e.) For NCP5911 driver, the
driver voltage is 5V and for NCP5901 driver, it is 12V.
(iii) DC Supply Source for Controller Voltage: The supply source for the controller should be able to
supply a 5V DC Source. The controller voltage is always 5V and is not dependent upon the driver used.
2 Electronic Load: The electronic load supplied to the DUALASYMA5VGEVB evaluation board ranges
from 0A to 25A. Hence a DC current source of 0A to 30A is needed for the evaluation board.
3 Meters to measure voltages and currents:
In the DUALASYMA5VGEVB Evaluation Board, the voltages that are to be measured are Vin, Vout and
Vdrvr. Similarly, the currents that are to be measured are Iin, Iout and Idrvr. The set up for measuring these
voltages and currents, and the meters required are shown in Figure 3. The currents are measured across
the shunt resistances that are connected across each of the terminals of input, output and driver voltages
as shown in Figure 3. For example, the output current is measured as,
. Similarly the input
and driver current can also be measured. The connecting wires from the output terminal to the electronic
load should be thicker in order to avoid losses and to measure the exact voltage at the end of the
terminals.
4 Oscilloscope: The oscilloscope is used to monitor the switch node waveforms. This should be an
analog or digital oscilloscope set for DC coupled measurement with 50MHz bandwidth. The resolution
can be set at 5V/division vertically and 20ns/division horizontally. The oscilloscope channels can be
connected at various test points such as High Side Driver (JS6), Low Side Driver (JS10), Switch Node
(JS8), G1 PWM Signal (JS11), Vin (sense) (J9 & J10) and Vout (sense) (J11 & J12).
8/21/2012
-1-
www.onsemi.com
�Test Set up and Procedure
1 Test Setup
The test set up, test points and components present on the DUALASYMA5VGEVB Evaluation Board are
shown in Figure 3.
Figure 3: Schematic of the Test Setup
The SO8FL parts placed on the evaluation board are the Q3 and Q4; the WDFN8 part placed on the
evaluation board is Q9 and shown in the schematic.
8/21/2012
-2-
www.onsemi.com
�Start up and Shut down procedures
Before starting the test, the oscilloscope probes should be connected. IR or k-type thermo-couples can be
used to monitor the temperature of the parts to make sure that they are still within the limits. IR monitoring
requires the removal of the oscilloscope probes due to the IR beam interference.
Start up procedure:
(1) Set the output voltage by changing the VID settings. The output voltage should not be changed with
either the controller or driver active. Currently set at 1.2V. (Please refer to the NCP5386 Datasheet
for changing the VID Settings).
(2) Initially set all the power supplies to 0V.
(3) Set the controller voltage to 5V.
(4) Set the driver voltage and then set the input voltage.
(5) Set the load current to required value. The load current must be incremented slowly to prevent the
transient spikes at CS1/CS2 thereby shutting down the controller. If the controller shuts down, the
input voltage must be set to zero, then the input power supply has to be turned off, then turned on
and Vin re-established.
Shut down Procedure:
(1) Shut down the Load.
(2) Reduce the input voltage to zero and then shut down the input power supply.
(3) Reduce the controller and driver voltages to zero and then shut down the driver power supply.
Test Procedure
(1) Before making any connections, make sure to set the power supplies for input voltage, controller and
the driver voltage at 0V. Also make sure that the load current is at 0A.
(2) Connect the Oscilloscope probes at the desired test points.
(3) Set the controller voltage to 5V.
(4) Set the driver voltage to the required value (For example, Vdrvr = 5V).
(5) After reaching the required driver voltage, set the input voltage as required. (For example, Vin = 12V).
(6) Set the load current slowly to the desired value. For example, Iout = 2.5A. (Refer to Start Up
Procedure #5).
(7) The frequency is already set to 330 kHz. If a different switching frequency is required, R13 and R14
have to be changed as per the data sheet of NCP5386. (Refer to Appendix).
(8) Connect the voltmeters/multi-meters to monitor the required parameters. (Refer to Figure 3).
(9) Obtain the required data and waveforms.
8/21/2012
-3-
www.onsemi.com
�Test Results
1 Efficiency Comparison between NTMFD4901NF and NTMFD4902NF devices tested in evaluation
board:
Vin 19V_Vo 1.0V_Drvr NCP5911 5V_330kHz_0 to 20A
89
87
EFFICIENCY, Ƞ (%)
85
83
81
79
77
75
0
5
10
15
20
LOAD CURRENT, IL (A)
NTMFD4901NF
NTMFD4902NF
Figure 4: Comparison of Efficiency in our Evaluation Board
8/21/2012
-4-
www.onsemi.com
�2 Power Loss Comparison between NTMFD4901NF and NTMFD4902NF devices tested in
evaluation board:
Vin 19V_Vo 1.0V_Drvr NCP5911 5V_330kHz_0 to 20A
7
6
POWER LOSS, PL (W)
5
4
3
2
1
0
0
5
10
15
20
LOAD CURRENT, (A)
NTMFD4901NF
NTMFD4902NF
Figure 5: Comparison of Power Losses
3 Temperature Comparison between NTMFD4901NF and NTMFD4902NF devices tested in
evaluation board:
8/21/2012
-5-
www.onsemi.com
�Vin 19V_Vo 1.0V_Drvr NCP5911 5V_330kHz_0 to 20A
100
90
TEMPERATURE, T ( ⁰C)
80
70
60
50
40
30
20
0
5
10
15
20
LOAD CURRENT, IL (A)
NTMFD4901NF
NTMFD4902NF
Figure 6: Comparison of Device Temperatures
4. Switch Node Voltage Waveforms of DUALASYMA5VGEVB Evaluation Board for Vdrvr = 5V
(i) At Iout = 17.5 A and Vdrvr = 5V (Vin = 19 V; Vout = 1.0V; Freq = 330kHz) NTMFD4901NF
8/21/2012
-6-
www.onsemi.com
�(ii) At Iout = 17.5 A and Vdrvr = 5V (Vin = 19V; Vout = 1.0V; Freq = 330kHz) NTMFD4902NF
Figures 7 and 8: Switch Node Waveforms for Vdrvr = 5V
5. PWM Signals from the Controller to the Driver at G1 Evaluation Board for Vdrvr = 5V
(i) At Iout = 0A (Vin = 12V; Vout = 1.2V; Vdrvr = 10V; Freq = 330kHz)
8/21/2012
-7-
www.onsemi.com
�Figure 9: PWM Signal at G1 for Iout = 0A
(ii) At Iout = 20A (Vin = 12V; Vout = 1.2V; Vdrvr = 10V; Freq = 330kHz)
Figure 10: PWM Signal at G1 for Iout = 20A
8/21/2012
-8-
www.onsemi.com
�
很抱歉,暂时无法提供与“DUALASYMB12VGEVB”相匹配的价格&库存,您可以联系我们找货
免费人工找货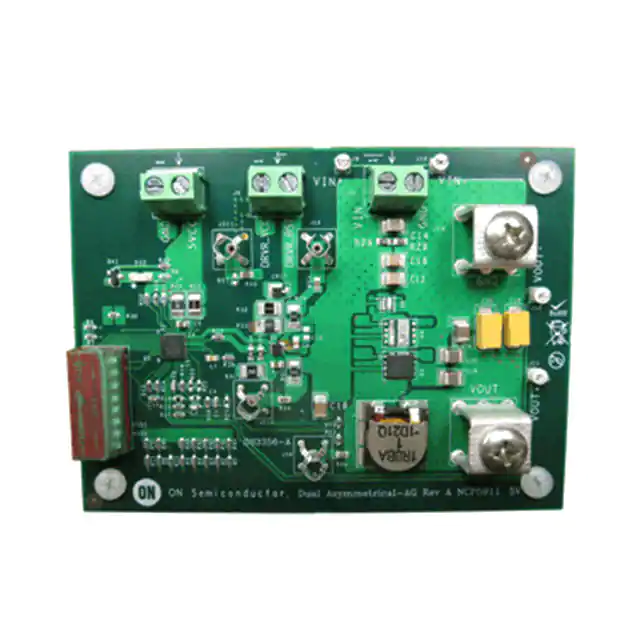


 工商网监
湘ICP备2023018690号
工商网监
湘ICP备2023018690号
