TPS7B83-Q1
SBVS376 – NOVEMBER 2020
TPS7B83-Q1 150-mA, 40-V, Low-Dropout Regulator
1 Features
3 Description
•
The TPS7B83-Q1 is a low-dropout linear regulator
designed to connect to the battery in automotive
applications. The device has an input voltage range
extending to 40 V, which allows the device to
withstand transients (such as load dump) that are
anticipated in automotive systems. With only an
18-µA quiescent current, the device is an optimal
solution for powering always-on components such as
microcontrollers (MCUs) and controller area network
(CAN) transceivers in standby systems.
•
•
•
•
•
•
•
•
•
•
AEC-Q100 qualified for automotive applications:
– Temperature grade 1: –40°C to +125°C, TA
– Junction temperature: –40°C to +150°C, TJ
Input voltage range: 3 V to 40 V (42 V max)
Output voltage range: 3.3 V and 5 V (fixed)
Output current: up to 150 mA
Output voltage accuracy: ±1% (max)
Low dropout voltage:
– 230 mV (max) at 150 mA (VOUT ≥ 3.3 V)
Low quiescent current:
– 18 µA (typ)
Excellent line transient response:
– ±2% VOUT deviation during cold-crank
– ±2% VOUT deviation (1-V/µs VIN slew rate)
Stable with a 2.2-µF or larger capacitor
Functional Safety-Capable
– Documentation available to aid functional safety
system design
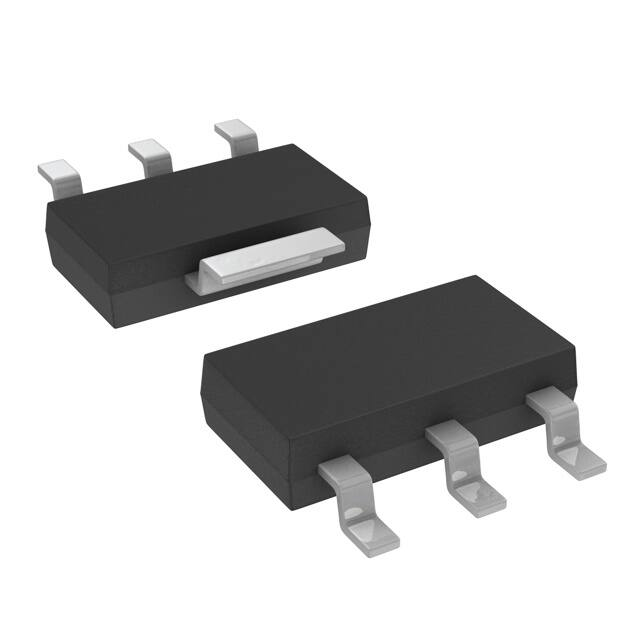
Package: 3-pin SOT-223
The device has state-of-the-art transient response
that allows the output to quickly react to changes
in load or line (for example, during cold-crank
conditions). Additionally, the device has a novel
architecture that minimizes output overshoot when
recovering from dropout. During normal operation, the
device has a tight DC accuracy of ±1% over line, load,
and temperature.
Device Information(1)
2 Applications
PART NUMBER
PACKAGE
BODY SIZE (NOM)
•
•
•
TPS7B83-Q1
SOT-223 (3)
6.50 mm × 3.50 mm
(1)
For all available packages, see the orderable addendum at
the end of the data sheet.
TPS7B83-Q1
45
40
0.25
VIN
VOUT 0.2
GND
35
0.15
30
0.1
25
0.05
20
0
15
-0.05
10
-0.1
5
-0.15
OUT
Typical Application Schematic
Input Voltage (V)
IN
0
0
500
1000
1500
Time (Ps)
2000
2500
Output Voltage (V)
Reconfigurable instrument clusters
Body control modules (BCM)
Always-on battery-connected applications:
– Automotive gateways
– Remote keyless entries (RKE)
-0.2
3000
Line Transient Response
(3-V/µs VIN Slew Rate)
An IMPORTANT NOTICE at the end of this data sheet addresses availability, warranty, changes, use in safety-critical applications,
intellectual property matters and other important disclaimers. PRODUCTION DATA.
�TPS7B83-Q1
www.ti.com
SBVS376 – NOVEMBER 2020
Table of Contents
1 Features............................................................................1
2 Applications..................................................................... 1
3 Description.......................................................................1
4 Revision History.............................................................. 2
5 Pin Configuration and Functions...................................3
6 Specifications.................................................................. 3
6.1 Absolute Maximum Ratings ....................................... 3
6.2 ESD Ratings .............................................................. 3
6.3 Recommended Operating Conditions ........................4
6.4 Thermal Information ...................................................4
6.5 Electrical Characteristics ............................................4
6.6 Typical Characteristics................................................ 6
7 Detailed Description......................................................12
7.1 Overview................................................................... 12
7.2 Functional Block Diagram......................................... 12
7.3 Feature Description...................................................13
7.4 Device Functional Modes..........................................14
8 Application and Implementation.................................. 15
8.1 Application Information............................................. 15
8.2 Typical Application.................................................... 19
9 Power Supply Recommendations................................20
10 Layout...........................................................................21
10.1 Layout Guidelines................................................... 21
10.2 Layout Example...................................................... 21
11 Device and Documentation Support..........................22
11.1 Device Support........................................................22
11.2 Receiving Notification of Documentation Updates.. 22
11.3 Support Resources................................................. 22
11.4 Trademarks............................................................. 22
11.5 Electrostatic Discharge Caution.............................. 22
11.6 Glossary.................................................................. 22
12 Mechanical, Packaging, and Orderable
Information.................................................................... 22
4 Revision History
NOTE: Page numbers for previous revisions may differ from page numbers in the current version.
2
DATE
REVISION
NOTES
November 2020
*
Initial release.
Submit Document Feedback
Copyright © 2021 Texas Instruments Incorporated
Product Folder Links: TPS7B83-Q1
�TPS7B83-Q1
www.ti.com
SBVS376 – NOVEMBER 2020
5 Pin Configuration and Functions
IN
1
GND
2
OUT
3
4
GND
Not to scale
Figure 5-1. DCY Package, 3-Pin SOT-223, Top View
Table 5-1. Pin Functions
PIN
NAME
GND
DCY
DESCRIPTION
2, 4
G
Ground pin. Connect this pin to the thermal pad with a low-impedance connection.
1
P
Input power-supply voltage pin. For best transient response and to minimize input
impedance, use the recommended value or larger ceramic capacitor from IN to ground,
as listed in the Recommended Operating Conditions table and the Input Capacitor section.
Place the input capacitor as close to the input of the device as possible.
O
Regulated output voltage pin. A capacitor is required from OUT to ground for stability. For
best transient response, use the nominal recommended value or larger ceramic capacitor
from OUT to ground; see the Recommended Operating Conditions table and the Output
Capacitor section. Place the output capacitor as close to output of the device as possible. If
using a high ESR capacitor, decouple the output with a 100-nF ceramic capacitor.
IN
OUT
(1)
TYPE(1)
3
I = input; O = output; P = power; G = ground.
6 Specifications
6.1 Absolute Maximum Ratings
over operating free-air temperature range (unless otherwise noted)(1)
MIN
IN
Unregulated input
MAX UNIT
–0.3
42
0.3(2)
V
OUT
Regulated output
–0.3
TA
Operating ambient temperature
–40
125
°C
TJ
Operating junction temperature
–40
150
°C
Tstg
Storage temperature
–65
150
°C
(1)
(2)
VIN +
V
Stresses beyond those listed under absolute maximum ratings may cause permanent damage to the device. These are stress ratings
only and functional operation of the device at these or any other conditions beyond those indicated under recommended operating
conditions isnot implied. Exposure to absolute-maximum-rated conditions for extended periods may affect devicereliability.
The absolute maximum rating is VIN + 0.3 V or 20 V, whichever is smaller.
6.2 ESD Ratings
VALUE
Human-body model (HBM), per AEC Q100-002(1)
V(ESD)
(1)
Electrostatic discharge
Charged-device model (CDM), per AEC
Q100-011
UNIT
±2000
All pins
±500
Corner pins
±750
V
AEC Q100-002 indicates that HBM stressing shall be in accordancewith the ANSI/ESDA/JEDEC JS-001 specification.
Submit Document Feedback
Copyright © 2021 Texas Instruments Incorporated
Product Folder Links: TPS7B83-Q1
3
�TPS7B83-Q1
www.ti.com
SBVS376 – NOVEMBER 2020
6.3 Recommended Operating Conditions
over operating free-air temperature range (unless otherwise noted)
MIN
TYP
MAX
3
UNIT
VIN
Input voltage
VOUT
Output voltage
1.2
18
V
IOUT
Output current
0
150
mA
COUT
Output capacitor(2)
2.2
220
µF
ESR
Output capacitor ESR requirements(3)
0.001
2
Ω
capacitor(1)
CIN
Input
TJ
Operating junction temperature
(1)
(2)
(3)
40
0.1
V
1
µF
–40
150
°C
For robust EMI performance the minimum input capacitance is 500 nF.
Effective output capacitance of 1 µF minimum required for stability.
If using a large ESR capacitor it is recommended to decouple this with a 100-nF ceramic capacitor to improve transient performance.
6.4 Thermal Information
TPS7B83-Q1
THERMAL METRIC(1) (2)
DCY
UNIT
3 PINS
RθJA
Junction-to-ambient thermal resistance(3)
77.1
°C/W
RθJC(top)
Junction-to-case (top) thermal resistance
41.7
°C/W
RθJB
Junction-to-board thermal resistance
11.7
°C/W
ψJT
Junction-to-top characterization parameter
3.3
°C/W
ψJB
Junction-to-board characterization parameter
11.5
°C/W
RθJC(bot)
Junction-to-case (bottom) thermal resistance
11.5
°C/W
(1)
(2)
(3)
The thermal data is based on the JEDEC standard high K profile,JESD 51-7. Two-signal, two-plane, four-layer board with 2-oz. copper.
The copper pad is soldered tothe thermal land pattern. Also, correct attachment procedure must be incorporated.
For more information about traditional and new thermal metrics,see the Semiconductor and IC PackageThermal Metrics application
report.
The 1s0p RθJA is 154.6℃/W for the DCY package.
6.5 Electrical Characteristics
specified at TJ = –40°C to +150°C, VIN = 13.5 V, IOUT = 0 mA, COUT = 2.2 µF, 1 mΩ < COUT ESR < 2 Ω, CIN = 1 µF typical
values are at TJ = 25°C
PARAMETER
TEST CONDITIONS
MAX
Regulated output accuracy DCY
ΔVOUT(ΔVIN)
Line regulation
VIN = VOUT + 500 mV
Change in percent of output
to 40 V,
voltage
IOUT = 100 µA
0.2
Load regulation
VIN = VOUT + 500 mV,
Change in percent of output
IOUT = 100 µA to
voltage
150 mA
0.2
Load transient response settling
time(2) (3)
ΔVOUT
Load transient response
overshoot, undershoot(3)
TJ = 25ºC
TYP
VOUT
ΔVOUT(ΔIOUT)
4
MIN
VIN = VOUT + 500 mV to
40 V,
IOUT = 100 µA to 150 mA (1)
TJ = –40°C to +150ºC
–0.75
0.75
–1
1
100
IOUT = 45 mA to 105
mA
–2%
IOUT = 0 mA to 150
mA
–10%
Submit Document Feedback
%
%
COUT = 10 µF
COUT = 10 µF
UNIT
µs
10%
%VOUT
Copyright © 2021 Texas Instruments Incorporated
Product Folder Links: TPS7B83-Q1
�TPS7B83-Q1
www.ti.com
SBVS376 – NOVEMBER 2020
6.5 Electrical Characteristics (continued)
specified at TJ = –40°C to +150°C, VIN = 13.5 V, IOUT = 0 mA, COUT = 2.2 µF, 1 mΩ < COUT ESR < 2 Ω, CIN = 1 µF typical
values are at TJ = 25°C
PARAMETER
IQ
Quiescent current
TEST CONDITIONS
VIN = VOUT + 500 mV to
40 V, IOUT = 0 mA
IOUT = 500 µA
MIN
TJ = 25ºC
TYP
MAX
18
21
TJ = –40°C to +150ºC
26
TJ = –40°C to +150ºC
35
IOUT ≤ 1 mA, VOUT ≥ 3.3 V, VIN = VOUT(NOM) x 0.95
130
Dropout voltage
VUVLO(RISING)
Rising input supply UVLO
VIN rising
2.6
VUVLO(FALLING) Falling input supply UVLO
VIN falling
2.38
IOUT = 150 mA, VOUT ≥ 3.3 V, VIN = VOUT(NOM)
VUVLO hysteresis
ICL
Output current limit
VIN = VOUT(nom) + 1 V, VOUT short to
90% x VOUT(NOM)
PSRR
Power-supply ripple rejection
VIN - VOUT = 500 mV, frequency = 1 kHz,
IOUT = 150 mA
Vn
Output noise voltage
VOUT = 3.3 V, BW = 10 Hz to 100 kHz
TSD(HYST)
(1)
(2)
(3)
180
160
230
2.7
2.82
2.5
2.6
230
TSD(SHUTDOWN) Junction shutdown temperature
Hysteresis of thermal shutdown
µA
47
IOUT = 105 mA, VOUT ≥ 3.3 V, VIN = VOUT(NOM)
VDO
VUVLO(HYST)
UNIT
180
220
mV
V
V
mV
260
mA
55
dB
280
µVRMS
175
°C
20
°C
Power dissipation is limited to 2W for IC production testing purposes. The power dissipation can be higher during normal operation.
Please see the thermal dissipation section for more information on how much power the device can dissipate while maintaining a
junction temperature below 150℃.
The settling time is measured from when IOUT is stepped from 45mA to 105 mA to when the output voltage recovers to
VOUT = VOUT(nom) - 5 mV.
This specification is specified by design.
Submit Document Feedback
Copyright © 2021 Texas Instruments Incorporated
Product Folder Links: TPS7B83-Q1
5
�TPS7B83-Q1
www.ti.com
SBVS376 – NOVEMBER 2020
6.6 Typical Characteristics
specified at TJ = –40°C to +150°C, VIN = 13.5 V, IOUT = 100 µA, COUT = 2.2 µF, 1 mΩ < COUT ESR < 2 Ω, and CIN = 1 µF
(unless otherwise noted)
5.015
0.1
150 mA
100 PA
0.05
0
0qC
25qC
85qC
125qC
150qC
5.005
Output Voltage (V)
Accuracy (%)
-55qC
-40qC
5.01
-0.05
-0.1
-0.15
-0.2
5
4.995
4.99
4.985
-0.25
4.98
-0.3
-60
-40
-20
0
20
40
60
80
Temperature (qC)
4.975
100 120 140 160
5
10
15
20
25
Input Voltage (V)
30
35
40
VOUT = 5 V, IOUT = 150 mA
Figure 6-1. Accuracy vs Temperature
Figure 6-2. Line Regulation vs VIN
5.015
5.015
-55qC
-40qC
5.01
0qC
25qC
85qC
125qC
150qC
5.005
5
4.995
4.99
150qC
4.995
4.99
4.985
4.98
4.98
4.975
5
10
15
20
25
Input Voltage (V)
30
35
40
5
10
VOUT = 5 V, IOUT = 5 mA
15
20
25
Input Voltage (V)
30
35
40
VOUT = 5 V, IOUT = 1 mA
Figure 6-3. Line Regulation vs VIN
Figure 6-4. Line Regulation vs VIN
5.015
5.01
-55qC
-40qC
5.01
0qC
25qC
85qC
125qC
-40 qC
25 qC
85 qC
150qC
5.0075
5.005
Output Voltage (V)
5.005
Output Voltage (V)
85qC
125qC
5
4.985
4.975
5
4.995
4.99
5.0025
5
4.9975
4.995
4.985
4.9925
4.98
4.99
4.975
0
25
50
75
100
Output Current (mA)
125
150
0
5
10
15
20
25
Input Voltage (V)
30
35
40
COUT = 10 µF
VOUT = 5 V
Figure 6-5. Load Regulation vs IOUT
6
0qC
25qC
5.005
Output Voltage (V)
Output Voltage (V)
-55qC
-40qC
5.01
Figure 6-6. Line Regulation at 50 mA
Submit Document Feedback
Copyright © 2021 Texas Instruments Incorporated
Product Folder Links: TPS7B83-Q1
�TPS7B83-Q1
www.ti.com
SBVS376 – NOVEMBER 2020
6.6 Typical Characteristics (continued)
specified at TJ = –40°C to +150°C, VIN = 13.5 V, IOUT = 100 µA, COUT = 2.2 µF, 1 mΩ < COUT ESR < 2 Ω, and CIN = 1 µF
(unless otherwise noted)
275
5.01
-40 qC
25 qC
85 qC
5.0075
0qC
25qC
Dropout Voltage (mV)
5.0025
5
4.9975
4.995
175
150
125
100
75
50
25
0
4.99
0
5
10
15
20
25
Input Voltage (V)
30
35
0
40
30
60
90
Output Current (mA)
100
90
90
80
70
60
50
40
30
10
0
10
100
1k
10k
100k
Frequency (Hz)
IOUT = 10 mA
IOUT = 1mA
1M
Power Supply Rejection Ratio (dB)
100
IOUT = 150 mA
IOUT = 100 mA
IOUT = 50 mA
80
70
60
50
40
30
20
VIN = 5.5 V
VIN = 6 V
VIN = 7 V
10
0
10
10M
COUT = 10 µF (X7R 50 V), VOUT = 5 V
Figure 6-9. PSRR vs Frequency and IOUT
2
1
0.5
Noise (PV/—Hz)
2
1
0.5
0.2
0.1
0.05
IOUT
10 mA, 252.5 PVRMS
150 mA, 267.6 PVRMS
100
1k
10k
100k
Frequency (Hz)
1M
1k
10k
100k
Frequency (Hz)
1M
10M
Figure 6-10. PSRR vs Frequency and VIN
10
5
0.002
0.001
10
100
VIN = 10 V
VIN = 13.5 V
COUT = 10 µF (X7R 50 V), IOUT = 150 mA, VOUT = 5 V
10
5
0.02
0.01
0.005
150
Figure 6-8. Dropout Voltage (VDO) vs IOUT
Figure 6-7. Line Regulation at 100 mA
20
120
VIN = 3 V
COUT = 10 µF
Power Supply Rejection Ratio (dB)
150qC
200
4.9925
Noise (PV/—Hz)
85qC
125qC
225
5.005
Output Voltage (V)
-55qC
-40qC
250
10M
0.2
0.1
0.05
0.02
0.01
0.005
0.002
0.001
10
VOUT = 3.3 V, COUT = 10 µF
IOUT
10 mA, 364.8 PVRMS
150 mA, 391.4 PVRMS
100
1k
10k
100k
Frequency (Hz)
1M
10M
VOUT = 5 V, COUT = 10 µF
Figure 6-11. Noise vs Frequency at 3.3 V
Figure 6-12. Noise vs Frequency at 5.0 V
Submit Document Feedback
Copyright © 2021 Texas Instruments Incorporated
Product Folder Links: TPS7B83-Q1
7
�TPS7B83-Q1
www.ti.com
SBVS376 – NOVEMBER 2020
6.6 Typical Characteristics (continued)
30
0.1
25
0.05
20
0
15
-0.05
10
5
0
0
500
1000
1500
Time (Ps)
2000
2500
300
VIN
VOUT 240
6
180
4
120
2
60
0
0
-2
-60
-4
-120
-0.1
-6
-180
-0.15
-8
-240
-10
-300
500
-0.2
3000
0
0
0
-50
-100
-100
-200
-150
AC Coupled Output Voltage (mV)
200
100
-300
0.5
1
1.5
2
2.5
3
Time (ms)
3.5
4
4.5
IOUT
100
0
-100
-100
-200
50
40
20
120
10
60
0
-10
-60
-20
-120
-30
-180
-40
-300
0
40
80
120
160
Time (Ps)
200
240
280
VOUT = 5 V, IOUT = 45 mA to 105 mA, slew rate = 0.1 A/µs,
VEN = 3.3 V, COUT = 10 µF
Figure 6-17. Load Transient, 45 mA to 105 mA
8
40
60
80
100 120
Time (Ps)
140
160
180
-300
200
200
-40qC
-240
-50
20
Figure 6-16. Load Transient, No Load to 100-mA Rising Edge
240
180
0
0
-50
300
30
IOUT
VOUT = 5 V, IOUT = 0 mA to 100 mA, slew rate = 1 A/µs,
VEN = 3.3 V, COUT = 10 µF
AC Coupled Output Voltage (mV)
150qC
150qC
50
0
Output Current (mA)
AC Coupled Output Voltage (mV)
25qC
25qC
-150
Figure 6-15. Load Transient, No Load to 100 mA
-40qC
450
200
VOUT = 5 V, IOUT = 0 mA to 100 mA, slew rate = 1 A/µs,
VEN = 3.3 V, COUT = 10 µF
40
400
100
5
50
350
300
-40qC
50
0
200 250 300
Time (Ps)
150
Output Current (mA)
AC Coupled Output Voltage (mV)
300
100
150
Figure 6-14. Line Transients at 5.5 V to 6.5 V
Figure 6-13. Line Transients at 13.5 V to 40 V
-40qC
25qC
150qC
IOUT
100
VOUT = 5 V, VIN = 5.5 V to 6.5 V, trise = 1 µs, COUT = 10 µF
VOUT = 5 V, IOUT = 1 mA, VIN = 13.5 V to 40 V,
slew rate = 2.7 V/µs, VEN = 3.3 V, COUT = 10 µF
150
50
Output Current (mA)
0.15
8
25qC
150qC
IOUT
150
30
100
20
50
10
0
0
-50
-10
-100
-20
-150
-30
-200
-40
0
20
40
60
80
100 120
Time (Ps)
140
160
180
Output Current (mA)
35
10
Input Voltage (V)
40
0.25
VIN
VOUT 0.2
Output Voltage (V)
Input Voltage (V)
45
AC Coupled Output Voltage (mV)
specified at TJ = –40°C to +150°C, VIN = 13.5 V, IOUT = 100 µA, COUT = 2.2 µF, 1 mΩ < COUT ESR < 2 Ω, and CIN = 1 µF
(unless otherwise noted)
-250
200
VOUT = 5 V, IOUT = 45 mA to 105 mA, slew rate = 0.1 A/µs,
VEN = 3.3 V, COUT = 10 µF
Figure 6-18. Load Transient, 45-mA to 105-mA Rising Edge
Submit Document Feedback
Copyright © 2021 Texas Instruments Incorporated
Product Folder Links: TPS7B83-Q1
�TPS7B83-Q1
www.ti.com
SBVS376 – NOVEMBER 2020
6.6 Typical Characteristics (continued)
specified at TJ = –40°C to +150°C, VIN = 13.5 V, IOUT = 100 µA, COUT = 2.2 µF, 1 mΩ < COUT ESR < 2 Ω, and CIN = 1 µF
(unless otherwise noted)
200
50
100
0
0
-50
-100
-100
-200
-150
-300
0
0.25
0.5
0.75
1
1.25
Time (ms)
1.5
1.75
300
-40qC
AC Coupled Output Voltage (mV)
100
150
150qC
IOUT
100
200
50
100
0
0
-50
-100
-100
-200
-150
2
0
VOUT = 5 V, IOUT = 0 mA to 150 mA, slew rate = 1 A/µs,
VEN = 3.3 V, COUT = 10 µF
Figure 6-19. Load Transient, No Load to 150 mA
25qC
20
40
60
80
100 120
Time (Ps)
140
160
180
Output Current (mA)
300
-40qC
25qC
150qC
IOUT
Output Current (mA)
AC Coupled Output Voltage (mV)
150
-300
200
VOUT = 5 V, IOUT = 0 mA to 150 mA, slew rate = 1 A/µs, VEN =
3.3 V, COUT = 10 µF
Figure 6-20. Load Transient, No Load to 150-mA Rising Edge
40
228
-55qC
-40qC
227
35
226
0qC
25qC
85qC
125qC
150qC
30
224
Iq (PA)
IOUT (mA)
225
223
222
221
25
20
220
219
15
Current Limit
218
-75
-45
-15
15
45
75
Temperature (qC)
105
135
10
5
VIN = VOUT + 1 V, VOUT = 90% × VOUT(NOM)
10
15
20
25
Input Voltage (V)
30
35
40
VOUT = 5 V
Figure 6-21. Output Current Limit vs Temperature
Figure 6-22. Quiescent Current (IQ) vs VIN
175
450
150
Iq (PA)
125
125qC
150qC
-55 qC
-40 qC
0 qC
400
350
Ground Current (PA)
-55qC
-40qC
0qC
25qC
85qC
100
75
50
25 qC
85 qC
125 qC
150 qC
300
250
200
150
100
25
50
0
0
0
5
10
15
20
25
Input Voltage (V)
30
35
40
0
25
50
75
100
Output Current (mA)
125
150
VOUT = 5 V
Figure 6-23. Quiescent Current (IQ) vs VIN
Figure 6-24. Ground Current (IGND) vs IOUT
Submit Document Feedback
Copyright © 2021 Texas Instruments Incorporated
Product Folder Links: TPS7B83-Q1
9
�TPS7B83-Q1
www.ti.com
SBVS376 – NOVEMBER 2020
6.6 Typical Characteristics (continued)
specified at TJ = –40°C to +150°C, VIN = 13.5 V, IOUT = 100 µA, COUT = 2.2 µF, 1 mΩ < COUT ESR < 2 Ω, and CIN = 1 µF
(unless otherwise noted)
26
281
280
25
Ground Current (PA)
Ground Current (PA)
279
278
277
276
275
274
273
24
23
22
272
-50
-25
0
25
50
75
Temperature (qC)
100
125
21
-75
150
-50
-25
0
25
50
75
Ambient Temperature (qC)
IOUT = 100 mA
125
Figure 6-26. Ground Current
2.8
20
200
Input Voltage
Output Voltage
Output Current
Falling Threshold
Rising Threshold
2.75
150
IOUT = 500 µA
Figure 6-25. Ground Current
15
150
2.7
Voltage (V)
UVLO Threshold (V)
100
2.65
2.6
10
100
5
50
0
0
2.55
2.5
Output Current (mA)
271
-75
2.45
-5
2.4
-60
0
-40
-20
0
20 40 60 80
Temperature (qC)
1
2
3
100 120 140 160
4
5
6
Time (ms)
7
8
9
-50
10
COUT = 10 µF
Figure 6-27. Undervoltage Lockout (UVLO) Threshold vs
Temperature
Figure 6-28. Startup Plot
20
18
OFF
Output voltage (V)
16
14
12
10
ON
8
6
4
0.2
0.4
0.6
0.8
1
1.2
Injected current (mA)
1.4
1.6
1.8
-50
-25
Figure 6-29. Output Voltage vs Injected Current
10
Submit Document Feedback
0
25
50
75 100 125
Temperature (qC)
150
175
200
Figure 6-30. Thermal Shutdown
Copyright © 2021 Texas Instruments Incorporated
Product Folder Links: TPS7B83-Q1
�TPS7B83-Q1
www.ti.com
SBVS376 – NOVEMBER 2020
6.6 Typical Characteristics (continued)
xx
xxx
xxxx
xxx
xxxx
xx
xxx
xxxx
xxx
xxxx
xxx
xx
xxx
xxxx
xxx
xxxx
xxx
xx
xxx
xxxx
xxx
xxxx
xxx
xx
specified at TJ = –40°C to +150°C, VIN = 13.5 V, IOUT = 100 µA, COUT = 2.2 µF, 1 mΩ < COUT ESR < 2 Ω, and CIN = 1 µF
(unless otherwise noted)
10
5
2
1
0.5
x
ESR (:)
0.2
0.1
0.05
x
Stable region
0.02
0.01
0.005
0.002
0.001
0.0005
x
0.0002
0.0001
1
2
3 4 5 6 78 10
20 30 50 70 100
COUT (PF)
200 300 500
Figure 6-31. Stability ESR vs COUT
Submit Document Feedback
Copyright © 2021 Texas Instruments Incorporated
Product Folder Links: TPS7B83-Q1
11
�TPS7B83-Q1
www.ti.com
SBVS376 – NOVEMBER 2020
7 Detailed Description
7.1 Overview
The TPS7B83-Q1 is a low-dropout linear regulator (LDO) designed to connect to the battery in automotive
applications. The device has an input voltage range extending to 40 V, which allows the device to withstand
transients (such as load dumps) that are anticipated in automotive systems. With only a 18-µA quiescent current
at light loads, the device is an optimal solution for powering always-on components.
The device has a state-of-the-art transient response that allows the output to quickly react to changes in the
load or line (for example, during cold-crank conditions). Additionally, the device has a novel architecture that
minimizes output overshoot when recovering from dropout. During normal operation, the device has a tight DC
accuracy of ±1% over line, load, and temperature.
7.2 Functional Block Diagram
IN
OUT
Current
Limit
R1
±
+
Thermal
Shutdown
UVLO
R2
Bandgap
12
GND
Submit Document Feedback
Copyright © 2021 Texas Instruments Incorporated
Product Folder Links: TPS7B83-Q1
�TPS7B83-Q1
www.ti.com
SBVS376 – NOVEMBER 2020
7.3 Feature Description
7.3.1 Undervoltage Lockout
The device has an independent undervoltage lockout (UVLO) circuit that monitors the input voltage, allowing a
controlled and consistent turn on and off of the output voltage. To prevent the device from turning off if the input
drops during turn on, the UVLO has hysteresis as specified in the Electrical Characteristics table.
7.3.2 Thermal Shutdown
The device contains a thermal shutdown protection circuit to disable the device when the junction temperature
(TJ) of the pass transistor rises to TSD(shutdown) (typical). Thermal shutdown hysteresis assures that the device
resets (turns on) when the temperature falls to TSD(reset) (typical).
The thermal time-constant of the semiconductor die is fairly short, thus the device may cycle on and off
when thermal shutdown is reached until power dissipation is reduced. Power dissipation during startup can
be high from large VIN – VOUT voltage drops across the device or from high inrush currents charging large
output capacitors. Under some conditions, the thermal shutdown protection disables the device before startup
completes.
For reliable operation, limit the junction temperature to the maximum listed in the Recommended Operating
Conditions table. Operation above this maximum temperature causes the device to exceed its operational
specifications. Although the internal protection circuitry of the device is designed to protect against thermal
overall conditions, this circuitry is not intended to replace proper heat sinking. Continuously running the device
into thermal shutdown or above the maximum recommended junction temperature reduces long-term reliability.
7.3.3 Current Limit
The device has an internal current limit circuit that protects the regulator during transient high-load current faults
or shorting events. The current limit is a brickwall scheme. In a high-load current fault, the brickwall scheme
limits the output current to the current limit (ICL). ICL is listed in the Electrical Characteristics table.
The output voltage is not regulated when the device is in current limit. When a current limit event occurs, the
device begins to heat up because of the increase in power dissipation. When the device is in brickwall current
limit, the pass transistor dissipates power [(VIN – VOUT) × ICL]. If thermal shutdown is triggered, the device
turns off. After the device cools down, the internal thermal shutdown circuit turns the device back on. If the
output current fault condition continues, the device cycles between current limit and thermal shutdown. For more
information on current limits, see the Know Your Limits application report.
Figure 7-1 shows a diagram of the current limit.
VOUT
Brickwall
VOUT(NOM)
IOUT
0V
0 mA
IRATED
ICL
Figure 7-1. Current Limit
Submit Document Feedback
Copyright © 2021 Texas Instruments Incorporated
Product Folder Links: TPS7B83-Q1
13
�TPS7B83-Q1
www.ti.com
SBVS376 – NOVEMBER 2020
7.4 Device Functional Modes
7.4.1 Device Functional Mode Comparison
The Device Functional Mode Comparison table shows the conditions that lead to the different modes of
operation. See the Electrical Characteristics table for parameter values.
Table 7-1. Device Functional Mode Comparison
OPERATING MODE
PARAMETER
VIN
IOUT
TJ
Normal operation
VIN > VOUT(nom) + VDO and VIN > VIN(min)
IOUT < IOUT(max)
TJ < TSD(shutdown)
Dropout operation
VIN(min) < VIN < VOUT(nom) + VDO
IOUT < IOUT(max)
TJ < TSD(shutdown)
VIN < VUVLO
Not applicable
TJ > TSD(shutdown)
Disabled
(any true condition
disables the device)
7.4.2 Normal Operation
The device regulates to the nominal output voltage when the following conditions are met:
•
•
•
The input voltage is greater than the nominal output voltage plus the dropout voltage (VOUT(nom) + VDO)
The output current is less than the current limit (IOUT < ICL)
The device junction temperature is less than the thermal shutdown temperature (TJ < TSD)
•
The enable voltage has previously exceeded the enable rising threshold voltage and has not yet decreased
to less than the enable falling threshold
7.4.3 Dropout Operation
If the input voltage is lower than the nominal output voltage plus the specified dropout voltage, but all other
conditions are met for normal operation, the device operates in dropout mode. In this mode, the output voltage
tracks the input voltage. During this mode, the transient performance of the device becomes significantly
degraded because the pass transistor is in the ohmic or triode region, and acts as a switch. Line or load
transients in dropout can result in large output-voltage deviations.
When the device is in a steady dropout state (defined as when the device is in dropout, VIN < VOUT(NOM) + VDO,
directly after being in a normal regulation state, but not during startup), the pass transistor is driven into the
ohmic or triode region. When the input voltage returns to a value greater than or equal to the nominal output
voltage plus the dropout voltage (VOUT(NOM) + VDO), the output voltage can overshoot for a short period of time
while the device pulls the pass transistor back into the linear region.
14
Submit Document Feedback
Copyright © 2021 Texas Instruments Incorporated
Product Folder Links: TPS7B83-Q1
�TPS7B83-Q1
www.ti.com
SBVS376 – NOVEMBER 2020
8 Application and Implementation
Note
Information in the following applications sections is not part of the TI component specification,
and TI does not warrant its accuracy or completeness. TI’s customers are responsible for
determining suitability of components for their purposes, as well as validating and testing their design
implementation to confirm system functionality.
8.1 Application Information
8.1.1 Input and Output Capacitor Selection
The TPS7B83-Q1 requires an output capacitor of 2.2 µF or larger (1 µF or larger capacitance) for stability
and an equivalent series resistance (ESR) between 0.001 Ω and 2 Ω. For the best transient performance, use
X5R- and X7R-type ceramic capacitors because these capacitors have minimal variation in value and ESR over
temperature. When choosing a capacitor for a specific application, be mindful of the DC bias characteristics for
the capacitor. Higher output voltages cause a significant derating of the capacitor. For best performance, the
maximum recommended output capacitance is 220 µF.
Although an input capacitor is not required for stability, good analog design practice is to connect a capacitor
from IN to GND. Some input supplies have a high impedance, thus placing the input capacitor on the input
supply helps reduce the input impedance. This capacitor counteracts reactive input sources and improves
transient response, input ripple, and PSRR. If the input supply has a high impedance over a large range of
frequencies, several input capacitors can be used in parallel to lower the impedance over frequency. Use a
higher-value capacitor if large, fast, rise-time load transients are anticipated, or if the device is located several
inches from the input power source.
8.1.2 Dropout Voltage
Dropout voltage (VDO) is defined as the input voltage minus the output voltage (VIN – VOUT) at the rated output
current (IRATED), where the pass transistor is fully on. IRATED is the maximum IOUT listed in the Recommended
Operating Conditions table. The pass transistor is in the ohmic or triode region of operation, and acts as a
switch. The dropout voltage indirectly specifies a minimum input voltage greater than the nominal programmed
output voltage at which the output voltage is expected to stay in regulation. If the input voltage falls to less than
the nominal output regulation, then the output voltage falls as well.
For a CMOS regulator, the dropout voltage is determined by the drain-source on-state resistance (RDS(ON)) of the
pass transistor. Therefore, if the linear regulator operates at less than the rated current, the dropout voltage for
that current scales accordingly. The following equation calculates the RDS(ON) of the device.
RDS(ON) =
VDO
IRATED
(1)
8.1.3 Reverse Current
Excessive reverse current can damage this device. Reverse current flows through the intrinsic body diode of the
pass transistor instead of the normal conducting channel. At high magnitudes, this current flow degrades the
long-term reliability of the device.
Conditions where reverse current can occur are outlined in this section, all of which can exceed the absolute
maximum rating of VOUT ≤ VIN + 0.3 V.
•
•
•
If the device has a large COUT and the input supply collapses with little or no load current
The output is biased when the input supply is not established
The output is biased above the input supply
If reverse current flow is expected in the application, external protection is recommended to protect the device.
Reverse current is not limited in the device, so external limiting is required if extended reverse voltage operation
is anticipated.
Submit Document Feedback
Copyright © 2021 Texas Instruments Incorporated
Product Folder Links: TPS7B83-Q1
15
�TPS7B83-Q1
www.ti.com
SBVS376 – NOVEMBER 2020
8.1.4 Power Dissipation (PD)
Circuit reliability requires consideration of the device power dissipation, location of the circuit on the printed
circuit board (PCB), and correct sizing of the thermal plane. The PCB area around the regulator must have few
or no other heat-generating devices that cause added thermal stress.
To first-order approximation, power dissipation in the regulator depends on the input-to-output voltage difference
and load conditions. The following equation calculates power dissipation (PD).
PD = (VIN – VOUT) × IOUT
(2)
Note
Power dissipation can be minimized, and therefore greater efficiency can be achieved, by correct
selection of the system voltage rails. For the lowest power dissipation use the minimum input voltage
required for correct output regulation.
For devices with a thermal pad, the primary heat conduction path for the device package is through the thermal
pad to the PCB. Solder the thermal pad to a copper pad area under the device. This pad area must contain an
array of plated vias that conduct heat to additional copper planes for increased heat dissipation.
The maximum power dissipation determines the maximum allowable ambient temperature (TA) for the device.
According to the following equation, power dissipation and junction temperature are most often related by the
junction-to-ambient thermal resistance (RθJA) of the combined PCB and device package and the temperature of
the ambient air (TA).
TJ = TA + (RθJA × PD)
(3)
Thermal resistance (RθJA) is highly dependent on the heat-spreading capability built into the particular PCB
design, and therefore varies according to the total copper area, copper weight, and location of the planes.
The junction-to-ambient thermal resistance listed in the Thermal Information table is determined by the JEDEC
standard PCB and copper-spreading area, and is used as a relative measure of package thermal performance.
8.1.4.1 Thermal Performance Versus Copper Area
The most used thermal resistance parameter, RθJA, is highly dependent on the heat-spreading capability built
into the particular PCB design, and therefore varies according to the total copper area, copper weight, and
location of the planes. The RθJA recorded in the Thermal Information table in the Specifications section is
determined by the JEDEC standard (see Figure 8-1), PCB, and copper-spreading area, and is only used as a
relative measure of package thermal performance. For a well-designed thermal layout, RθJA is actually the sum
of the package junction-to-case (bottom) thermal resistance (RθJCbot) plus the thermal resistance contribution by
the PCB copper.
16
Submit Document Feedback
Copyright © 2021 Texas Instruments Incorporated
Product Folder Links: TPS7B83-Q1
�TPS7B83-Q1
www.ti.com
SBVS376 – NOVEMBER 2020
Mold
Compound
Die
Wire
Die
Attach
2oz
Signal
Trace
Internal Signal
or power plane
1oz copper
Lead
Frame
Internal
GND plane
1oz copper
Thermal
Pad or Tab
of the LDO
Bottom
Relief
2oz copper
Thermal
Vias
Figure 8-1. JEDEC Standard 2s2p PCB
Figure 8-2 and Figure 8-3 depict the functions of RθJA and ψJB versus copper area and thickness. These plots
are generated with a 101.6-mm x 101.6-mm x 1.6-mm PCB of two and four layers. For the four-layer board,
the inner planes use a 1-oz copper thickness. Outer layers are simulated with both a 1-oz and 2-oz copper
thickness. A 4 x 4 array of thermal vias of 300-µm drill diameter and 25-µm Cu plating is located beneath the
thermal pad of the device. The thermal vias connect the top layer, the bottom layer and, in the case of the 4-layer
board, the first inner GND plane. Each of the layers has a copper plane of equal area.
4
4
2
2
105
Layer
Layer
Layer
Layer
PCB,
PCB,
PCB,
PCB,
1
2
1
2
oz
oz
oz
oz
copper
copper
copper
copper
95
85
75
65
55
45
35
0
10
20
30
40
50
60
70
Cu Area Per Layer (cm 2)
80
90
Figure 8-2. RθJA vs Copper Area 2s2p DCY
Package
100
20
Thermal Resistance -


 工商网监
湘ICP备2023018690号
工商网监
湘ICP备2023018690号

